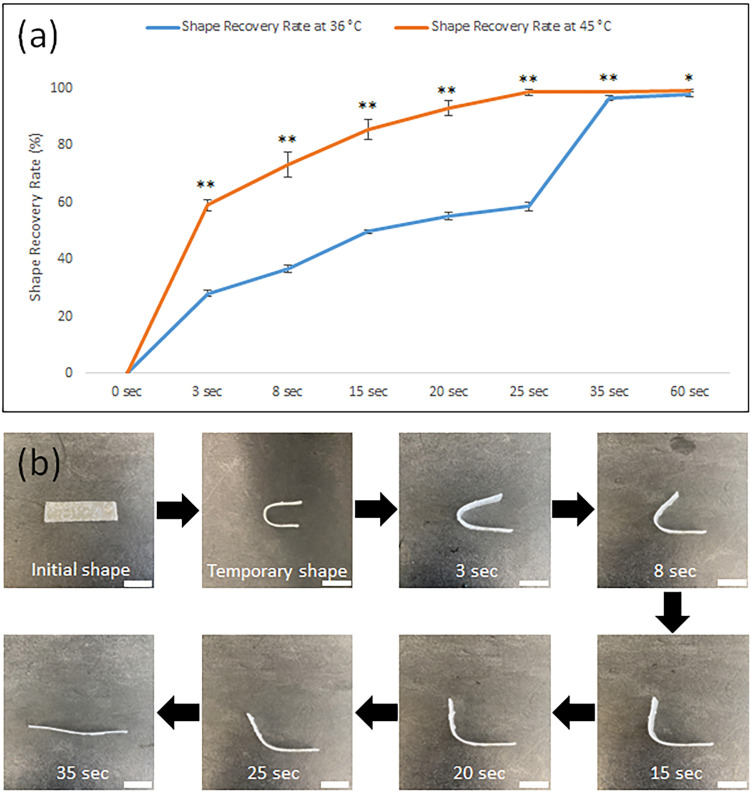
Figure 4.
(a) The comparison of the shape recovery rate of the 4D strip at two different temperatures, 36 °C and 45 °C. Data are the mean ± standard deviation; n=9, *p<0.05 and **p<0.01 compared to the shape recovery rate data at 36 °C at each time point. (b) Sequential images of the shape recovery process of the 4D strip at 36 °C. Scale bars, 1 cm.

