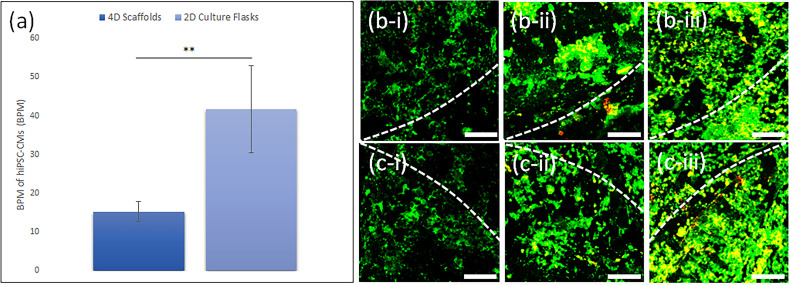
Figure 7.
(a) Beating rate of hiPSC-CMs on the cell culture flasks and 4D constructs for 7 days. Data are the mean ± standard deviation; n=9 and **p<0.01. Confocal microscope images of live-dead assay stained hiPSC-CMs seeded on the HX 4D construct before its shape transformation on (b-i) day 1, (b-ii) day 4, and (b-iii) day 7. Confocal microscope images of live-dead assay stained hiPSC-CMs seeded on the HX 4D construct after its shape transformation on (c-i) day 1, (c-ii) day 4 and (c-iii) day 7. Scale bars, 100 µm.

