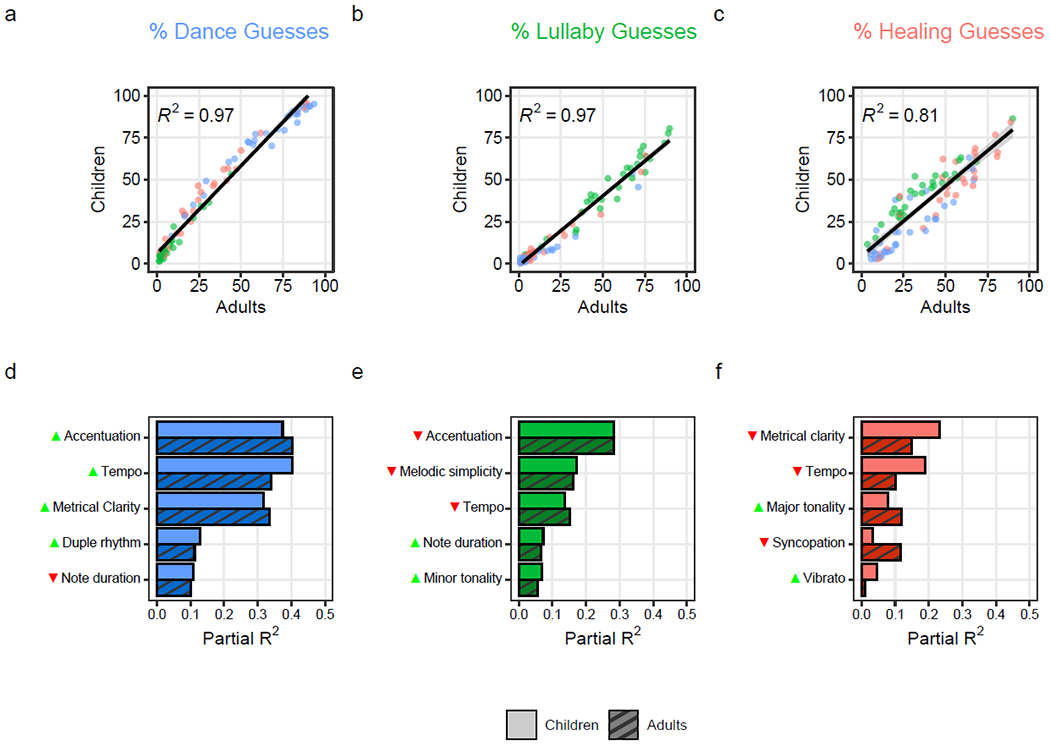
Figure 3. Children and adults make highly similar musical inferences, which are driven by the same acoustic features.

The scatterplots (a-c) show the tight correlations between children’s and adults’ musical inferences. Each point represents average percent guesses that it was (a) “for dancing”; (b) “for putting a baby to sleep”; and (c) “to make a sick person feel better”; the songs’ behavioral contexts are color-coded, with dance songs in blue, lullabies in green, and healing songs in red. The lines depict simple linear regressions and the gray shaded areas show the 95% confidence intervals from each regression. The bar plots (d-f) show the similar amounts of variance (partial-R2) in childrens’ (lighter bars) and adults’ (darker bars) guesses that is explained by musical features selected via LASSO regularization, for each of the three song types, computed from multiple regressions. The arrows beside each musical feature indicate the direction of effect, with green upwards arrows indicating increases (e.g., faster tempo) and red downward arrows indicating decreases (e.g., slower tempo).
