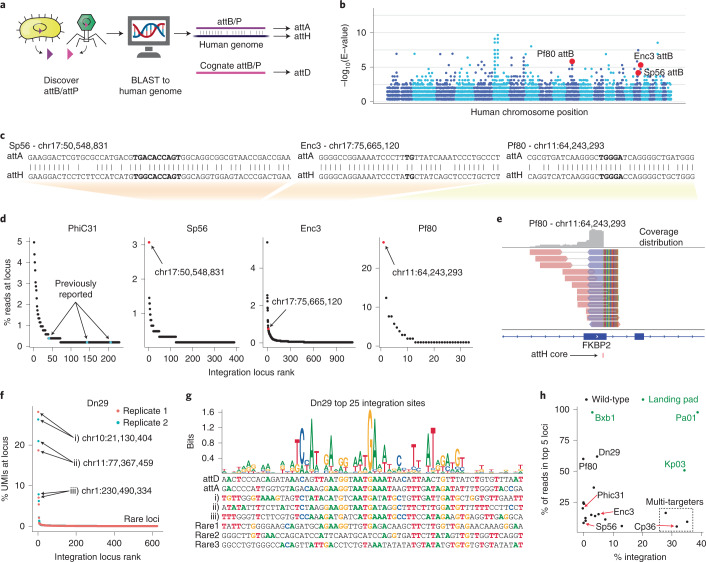
Fig. 4. Discovery of specific human genome-targeting recombinases.
a, Predicted attB and attP sequences were searched against the human genome using BLAST. The attachment site with the best match to the human genome is denoted attA (acceptor), and the corresponding human target site is denoted attH (human). The cognate attachment site is denoted attD (donor). b, BLAST hits of attB and attP sites that are homologous to sequences in the human genome. All hits that meet E < 1 × 10⁻³ are shown. The 22 autosomal chromosomes are shown in numerical order from left to right in alternating colors. c, Alignments of the microbial attachment sites (attA) to the predicted human attachment sites (attH) for three candidates. The attachment site center is bolded, representing the portion of the native attP and attB that is identical. d, Detected integration loci, ranked according to the number of uniquely mapped reads. Blue points are previously reported integration sites for PhiC31, and red points indicate predicted integration sites for Sp56, Enc3 and Pf80. e, Reads at the top integration site. Reads that align in the forward direction are shown in red, and those aligning in the reverse direction are shown in blue, with a gray line connecting paired reads. f, Detected integration loci for Dn29. UMIs were incorporated into the donor plasmid. The top three integration sites and sites with only one detected UMI (‘rare’) are highlighted. Results of three biological replicates are shown. g, A target site motif for Dn29 calculated using the top 25 target sites in K562 cells. Example integration sites are shown below, including the top three integration sites and three sites with only one detected UMI (rare1, rare2 and rare3). Colored nucleotides match the most common nucleotide at that position in the top 25 sites. h, LSR integration specificity and efficiency. For wild-type cells (black), efficiency is a corrected percentage of mCherry+ cells 18 days after electroporation with an LSR and donor plasmid. For landing pad cells (green), efficiency is the mean of mCherry+ cells in all clones (from Fig. 2g, right). To estimate specificity, UMI counts were used if available; otherwise, uniquely mapped read counts were used, and counts were merged across replicates.

