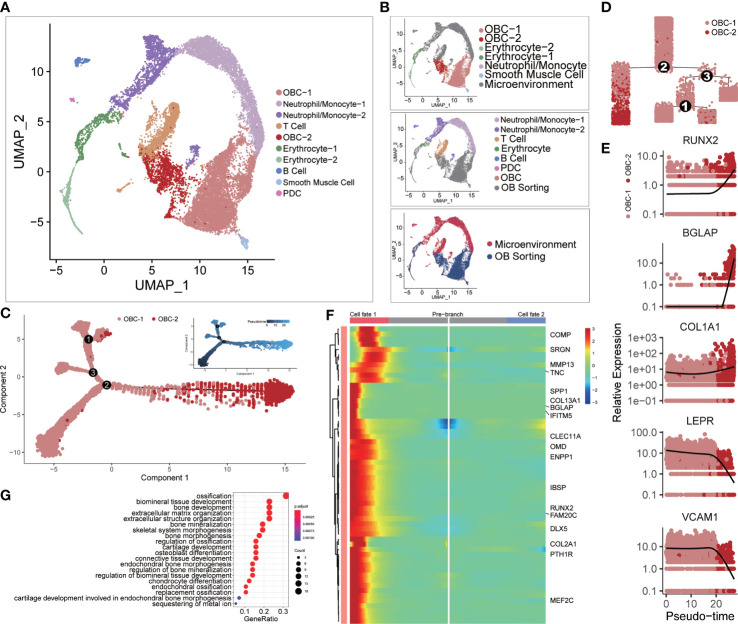
Figure 1.
Single-cell clustering analysis. (A) Single-cell clustering results after CCA integration analysis. (B) The upper panel shows cell cluster information of microenvironment cells before integration analysis using the same clustering layout in panel (A) The middle panel shows cell cluster information of OB sorting dataset before integration analysis using the same clustering layout. The lower panel markers the source of each cell. (C) Cell developmental trajectory inference of OBC-1 and OBC-2. The upper-right trajectory plot indicates the direction of pseudotime. (D) Cell lineage relationships in panel (C). (E) Expression levels (log-normalized) of indicated genes with respect to their pseudotime coordinates. The x-axis indicates the pseudotime, while the y-axis represents the log-normalized gene expression levels. Black lines depict the LOESS regression fit of the normalized expression values. (F) Continuum of up regulated-genes in cell fate 1 around branch point 2 in panel (D) Cell fate 1 is correlated to the left branch after branch point 2 in panel (D) Marked names of ossification-related genes. (G) GO analysis results of up regulated-genes in cell fate 1.

