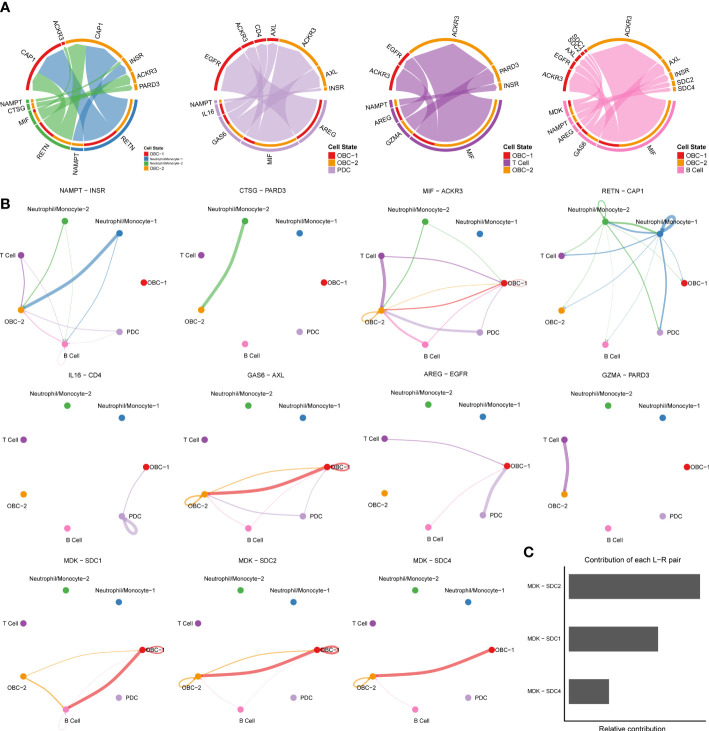
Figure 3.
Cell communication results based on CellChat. (A) Chord diagrams of immune cell-OBC communications. Width of edge represents the interaction strength. Thicker edge line indicates a stronger signal. Edge direction was from ligand to receptor. (B) Circle plots of L-R pairs between different cell groups. Width of edge represents the interaction strength. Thicker edge line indicates a stronger signal. (C) Relative contribution of each L-R pair to the overall communication network of MK signaling pathway.

