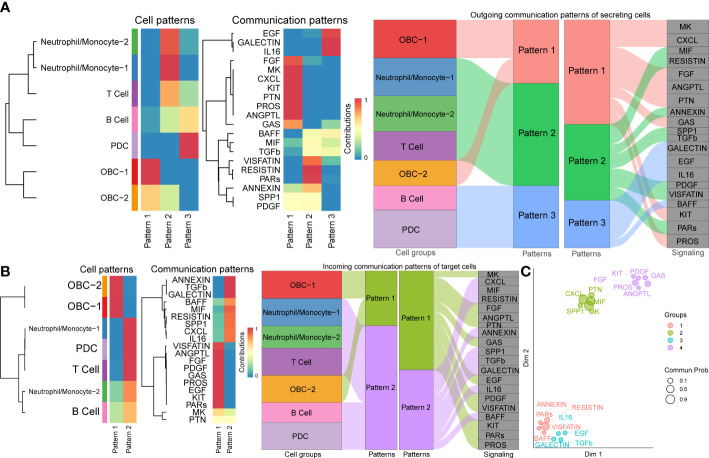
Figure 5.
Cell communication patterns. (A) The inferred outgoing communication patterns of cells (Left plot). The inferred outgoing communication patterns of pathways (Middle plot). The correspondence between the inferred latent patterns of cell clusters and signaling pathways (Right plot). (B) The inferred incoming communication patterns of cells (Left plot). The inferred incoming communication patterns of pathways (Middle plot). The correspondence between the inferred latent patterns of cell clusters and signaling pathways (Right plot). (C) Projecting signaling pathways according to their functional similarity. Dot size is proportional to the overall communication probability. Different colors represent different pathway groups.

