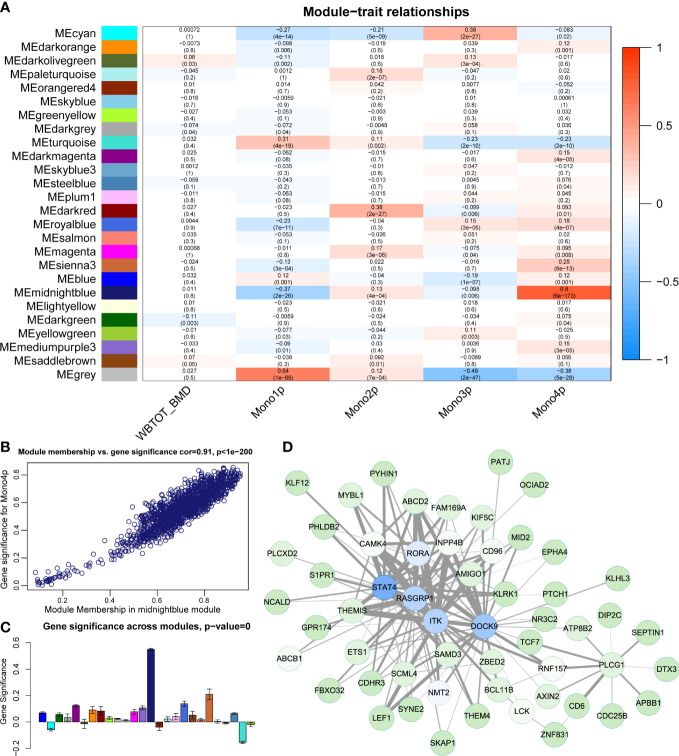
Figure 6.
Construction of gene correlation modules. (A) Module-trait relationship heatmap. Each row indicates a module eigengene, and each column presents cell subtype proportion. The corresponding correlation and P value have been marked. (B) Scatter plots of module membership vs. gene significance in midnightblue module. (C) Gene significance of Mono4 proportion crosses modules. (D) Gene member network of midnightblue module. Top 150 gene connections (by topological overlap) among the top 100 hub genes (by kME) are shown in the network.

