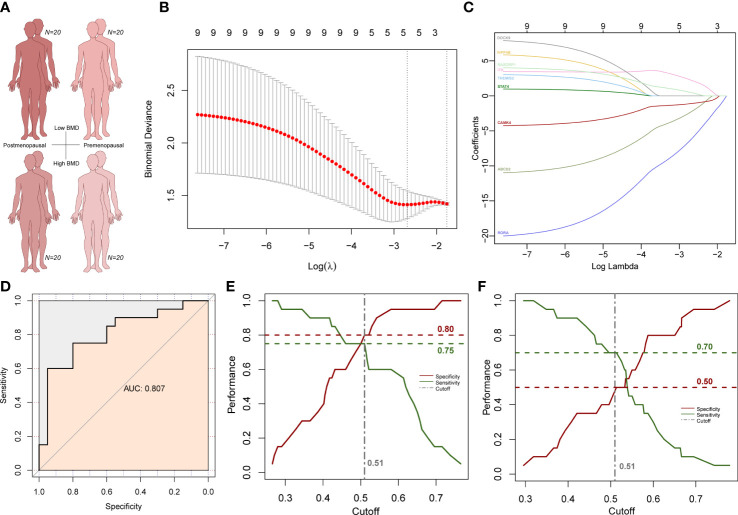
Figure 8.
LASSO analysis results in female subjects. (A) Age and BMD information of four subject groups. (B) Subnetwork gene expression features selection in the LASSO model. (C) Coefficient curves of subnetwork genes. (D) ROC curves of the prediction model. (E) Cutoff selection based on specificity and sensitivity performance in postmenopausal group. (F) Specificity and sensitivity performance under the same cutoff value in the premenopausal group.

