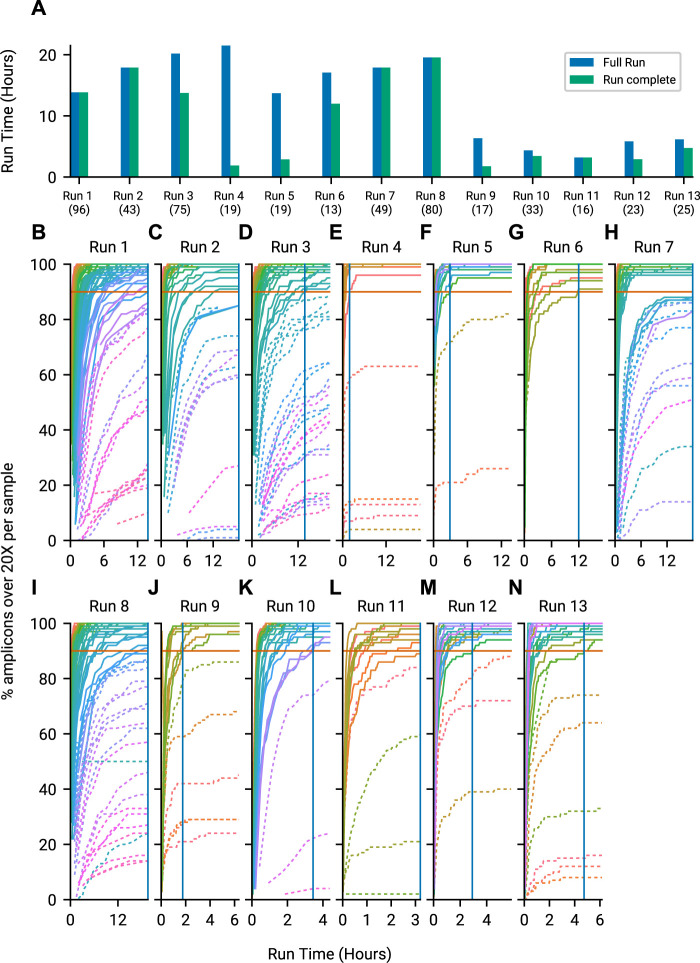
FIGURE 4.
Time savings by using minoTours ARTIC Pipeline and amplicon coverages for each run, across the course of the run. (A) The Full Run time point plotted against minoTours Run complete time point as hours since the run started, for each run. Number of samples shown in brackets below the run label. (B–N) Samples across 13 runs showing the percentage of amplicons at 20× over time. Barcodes that we project to finish are displayed with solid lines, whilst barcodes we project not to finish are dashed. 90% (Our threshold for firing) is marked on each plot. Once all barcodes that are projected to finish cross the 90% threshold, we would instruct MinKNOW to stop the run. This time is marked by a solid blue vertical line.

