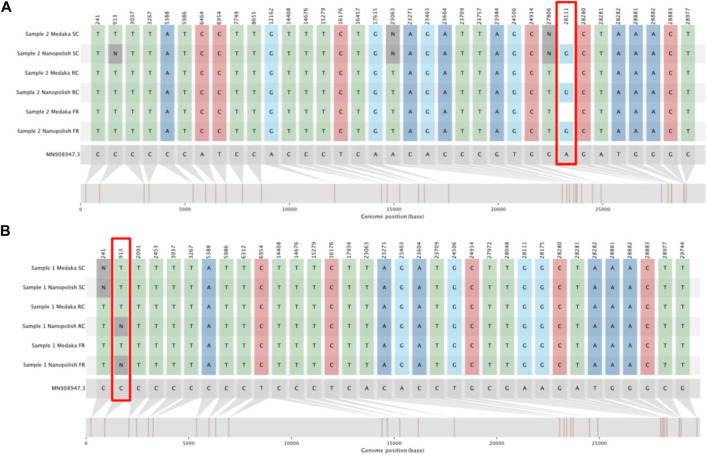
FIGURE 5.
SNIPIT plots demonstrating particularly divergent positions for SNP calls between Medaka and Nanopolish. The tracks from top to bottom show SNPs as called from consensus genomes for the Sample Complete time, Run Until and Full run time points (in this order) for both the Medaka and Nanopolish pipelines. (A) SNIPIT plot showing an example pair of consensus genomes with Nanopolish calling a SNP at position 28111 but Medaka calling reference. (B) SNIPIT plot, showing the Nanopolish pipeline switch from a SNP to an N at position 913 with more data, on a single sample across our three time points.

