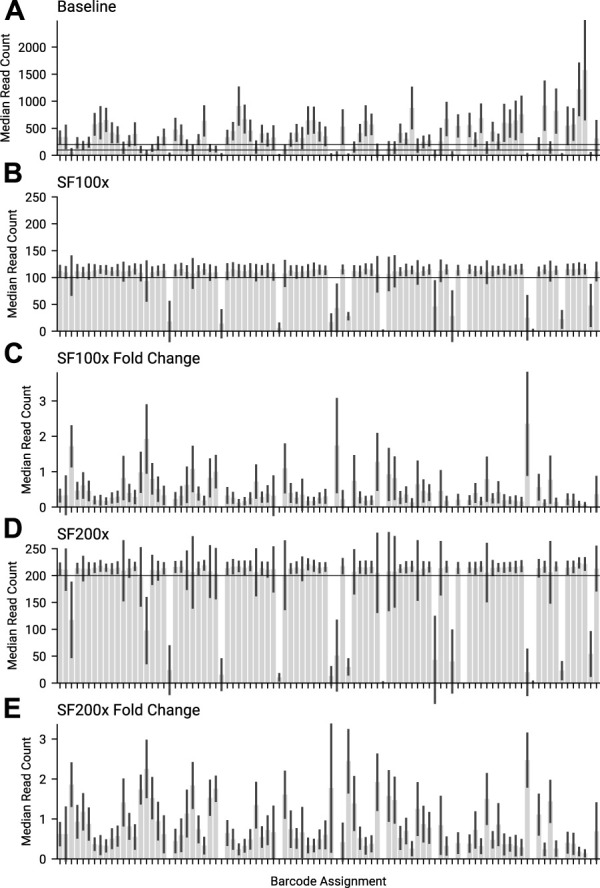
FIGURE 6.

The median amplicon read count for each barcode, for the same library across different swordfish threshold targets. (A) Baseline, where no adaptive sampling was applied. 100 and 200 are marked as the targets for the other 2 experiments. (B) SF100 had a 100× coverage swordfish threshold target. 100× is marked on the graph. (C) Fold change for the median amplicon read count per barcode, between SF100x and Baseline. (D) SF200 had a 200× coverage threshold target. 200 is marked on the graph. (E) Fold change for the median amplicon read count per barcode, between SF200x and Baseline.
