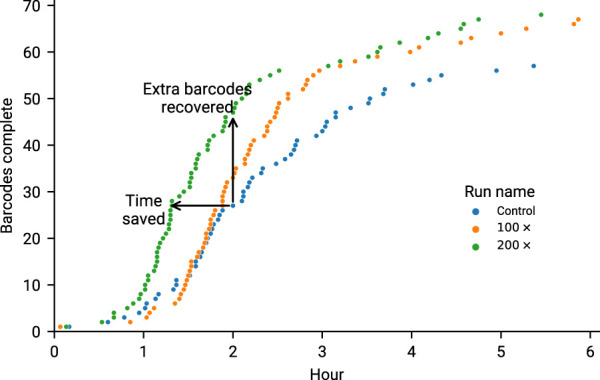
FIGURE 7.

Overlapped runs in our second experiment (6 h of sequencing) marking the time at which a barcode reached 90% of amplicons at 20×. It is worth noting the increased performance of 200× is likely due to the increased yield, as this was the first run to go on. Time saved is considered to be points for a run that are shifted left of their equivalents on the y-axis. Any points above the Control run (at the same time) are considered as extra barcodes recovered.
