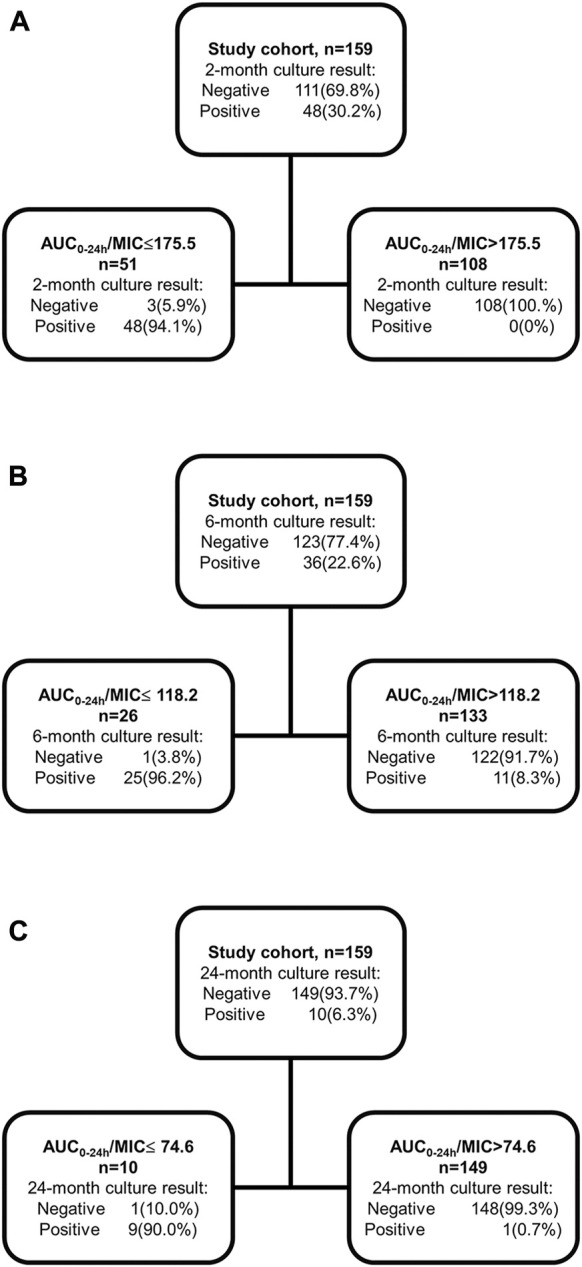
FIGURE 5.

Classification and Regression Tree analysis for the thresholds to differentiate the 2-month, 6-month sputum conversion and successful treatment outcome in the validation cohort. Classification and Regression Tree analysis was applied to identify the thresholds predictive of 2-month (A), 6-month (B) sputum conversion and successful treatment outcome (C). AUC0-24h: area under drug concentration-time curve over the last 24-h dosing interval; MIC: minimum inhibitory concentration.
