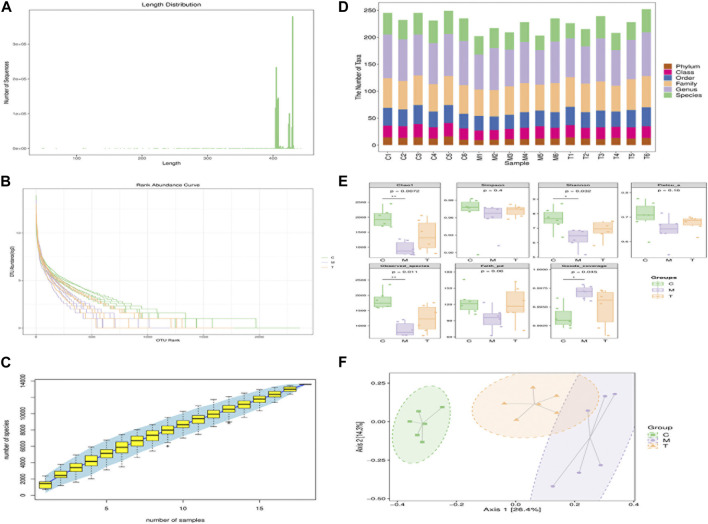
FIGURE 2.
(A) Sequence length distribution of 16s RNA post-sequencing; (B) Sequencing abundance rank curve. The horizontal coordinate represents the ordinal number of ASVs/OTUs in order of abundance; the vertical coordinate represents log2 log value of the abundance (mean) of each ASV/OTU in the sample (group); each fold line represents a sample (group) and the length of the fold line on the horizontal axis reflects the abundance of that group in terms of ASV/OTU number. (C) Specaccum species accumulation curve plot. The horizontal coordinate represents the sample size, the vertical coordinate represents the number of species (ASV/OTU) observed, and the blue shaded region reflects the confidence interval of the curve. The results reflect the rate of increase in the number of new species observed as the sample size expanded over the course of sampling. (D) Statistics of the number of microbial taxonomic units observed at each level. The horizontal coordinates represent the sample names and the vertical coordinates represent the number of taxonomic units contained at each of the six levels of phylum, order, family, genus and species. (E) Box plot of the groupings of α diversity. The horizontal coordinates represent the grouping labels and the vertical coordinates represent the values of the corresponding α diversity indices. (F) Principal Coordinates Analysis (PCoA); Two-dimensional ranking plot of the samples.

