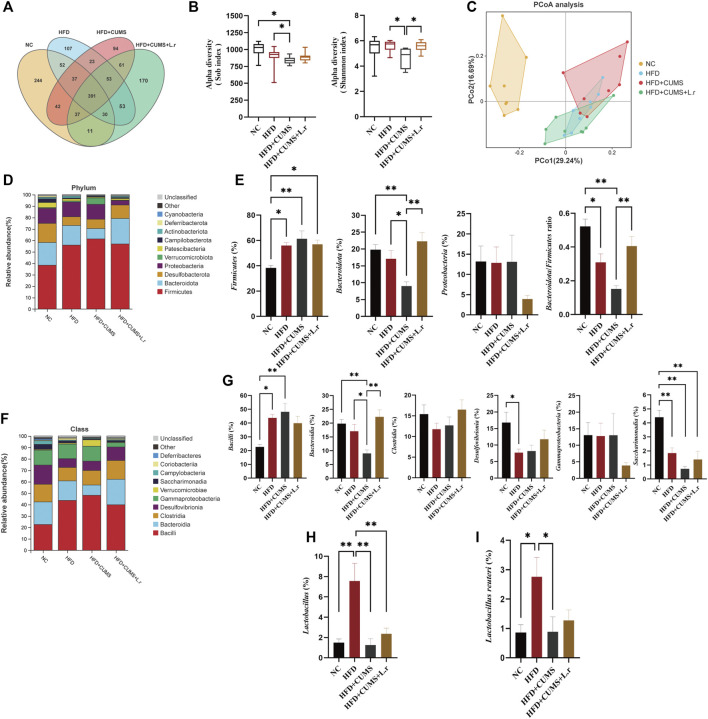
FIGURE 8.
Gavage with Lactobacillus reuteri reshaped the microbiome dysbiosis (n = 8/group). (A) OTU Venn diagram between 4 groups. (B) Sob and Shannon indexes of the gut microbiota. (C) Weighted UniFrac PCoA analysis of the gut microbiota. (D) Phylum-level distribution of fecal microbiota. (E) Relative abundance of the phyla Firmicutes, Bacteroidetes, Proteobacteria and Bacteroidetes/Firmicutes ratio. (F) Class-level distribution of fecal microbiota. (G) Relative abundance of identified differential abundant bacterial groups at class level. (H) Relative abundance of Lactobacillus at genus level. (I) Relative abundance of Lactobacillus reuteri at species level. Data are shown as the mean ± SEM. *p < 0.05, **p < 0.01 (Statistical comparisons between the two groups were performed using the two independent samples t-test. Comparisons between multiple groups were performed using One-way ANOVA and Tukey test.).

