. 2023 Mar 31;104(4):195–204. doi: 10.4174/astr.2023.104.4.195

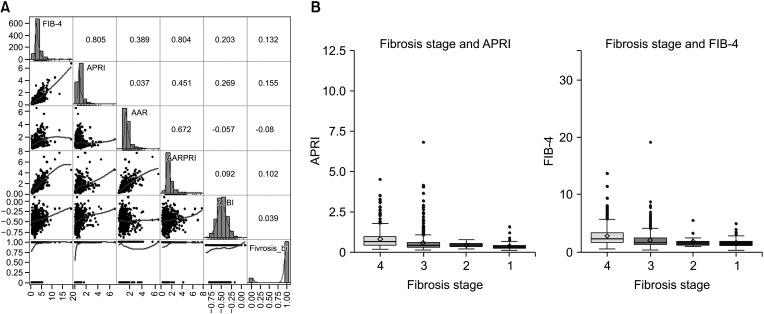
Fig. 3. Fibrosis stage and fibrosis-related biomarkers. (A) Correlation between fibrosis stages is divided into 2 groups (higher stage defined as fibrosis stage 3 and 4, and lower stage defined as stage 0, 1, and 2) and 5 biomarkers. (B) Correlation between Metavir fibrosis stage and APRI and FIB-4. Box plot of the APRI and FIB-4 index is shown according to the fibrosis stage (stage 0 was included in stage 1). The bottom and top of each box represent the 25th and 75th percentiles, giving the interquartile range. The line through the box indicates the median value, and the error bar indicates the 5th and 95th percentiles. FIB-4, fibrosis index based on 4 factors; APRI, AST-to-platelet ratio index; AAR, AST-to-ALT ratio; AARPRI, AAR-to-platelet ratio index; ALBI, albumin-bilirubin score.

Fig. 3