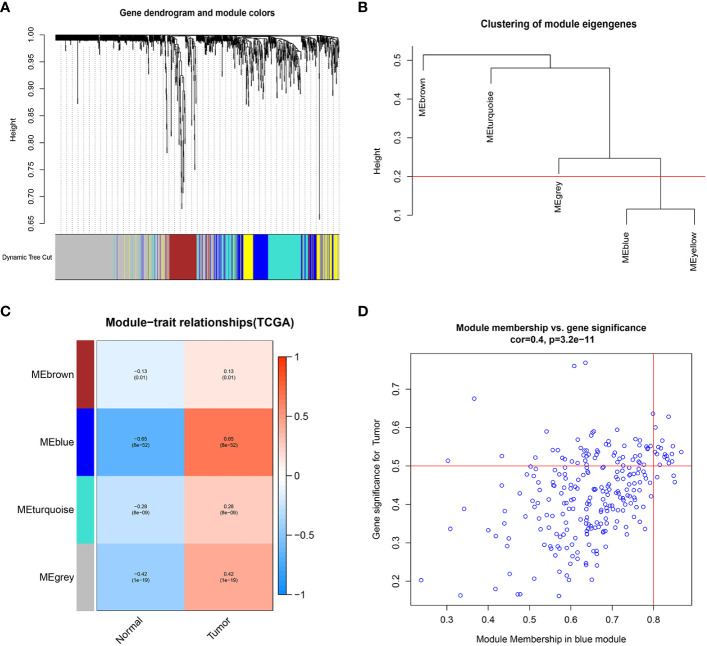
Figure 1.
Weighted gene co-expression network analysis. (A) Clustering dendrogram of genes, with dissimilarity based on topological overlap, together with assigned module colors. (B) Visual representation of the weight relationship of modular genes in an eigengene network. (C) Module-trait associations: Each row corresponds to a module eigengene and the column to the tumor and normal. Each cell contains the corresponding correlation and p-value. (D) Correlation graph of genes and tumors in the blue module.

