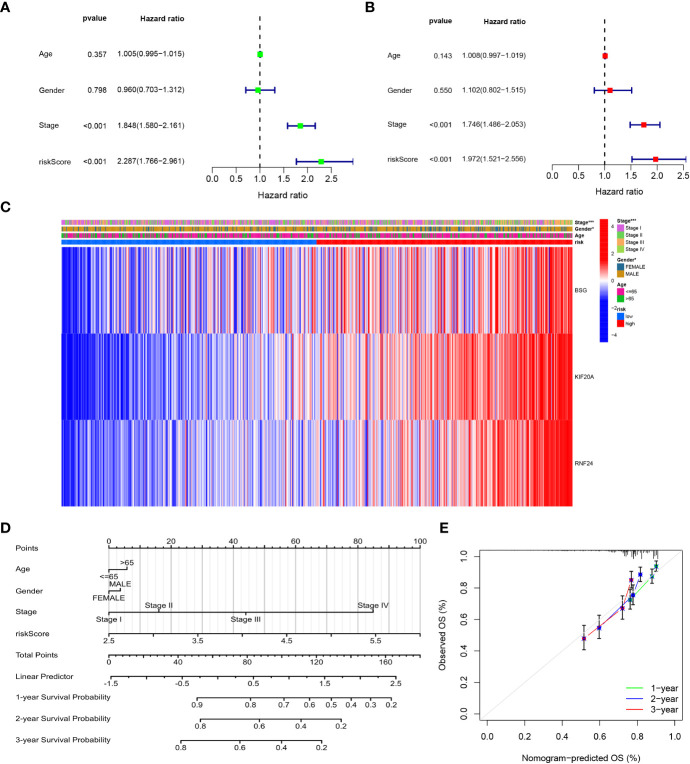
Figure 10.
Independent prognostic analysis and Construction and validation of the Nomograms. (A) Univariate cox regression analysis for the TCGA cohort. (B) Multivariate cox regression analysis for the TCGA cohort. (C) The correlations between the GARGs and clinicopathologic characters of the high-risk group and low-risk group were shown as a heatmap. (D) Construction of the Nomograms. (E) The calibration curves displayed the accuracy of the nomogram in the 1-, 2- and 3 years.

