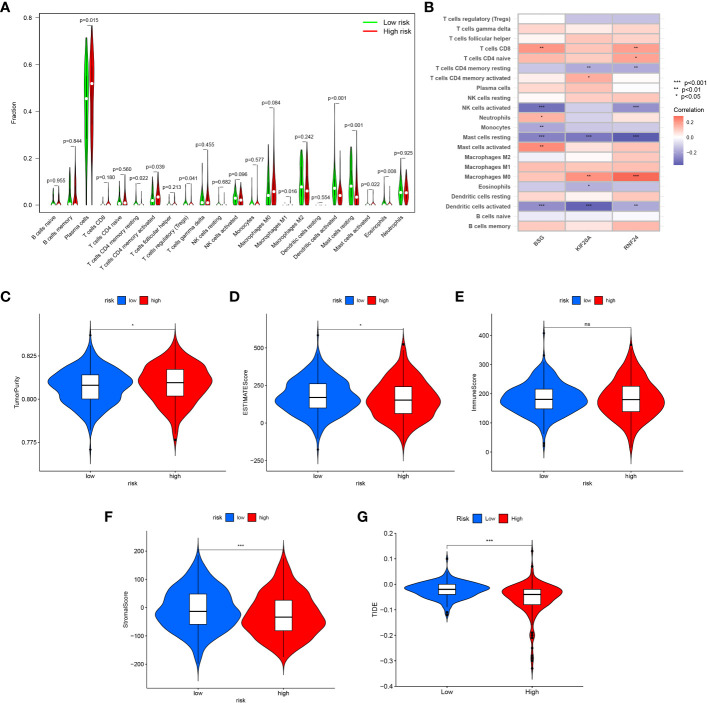
Figure 13.
Immune infiltration and tumor microenvironment analysis between high-risk and low-risk groups. (A) The CIBERSORT algorithm was used to calculate the immune cell infiltration between the high and low risk groups. (B) The correlation between the signature genes and immune cells. (C) TumorPurity between the two risk groups. (D) ESTIMATEScore between the two risk groups. (E) ImmuneScore between the two risk groups. (F) StromalScore between the two risk groups. (G) Comparison of the scores of TIDE between the high and low risk group. *<0.05; ns, Not Significant.

