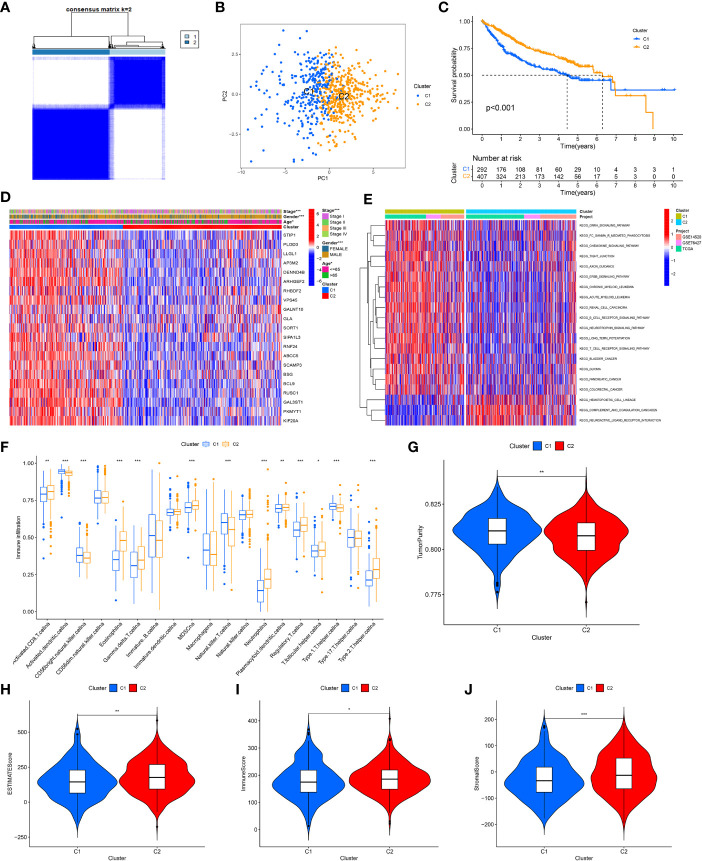
Figure 4.
Identification of tumor subtypes based on the GARGs. (A) Two clusters were identified according to the best consensus matrix (k=2). (B) Principal Component Analysis (PCA) demonstrates the degree of differentiation between the two subtypes. (C) The overall survival between the two subtypes. (D) Comparison of GARGs expression and clinical characteristics between the two subtypes. (E) Gene Set Variation Analysis (GSVA) was performed to analyze the differences between the two subtypes. (F) The immune cell infiltration between the two subtypes was analyzed by the ssGSEA. (G) TumorPurity between the two subtypes. (H) ESTIMATEScore between the two subtypes. (I) ImmuneScore between the two subtypes. (J) StromalScore between the two subtypes. *P<0.05, **P<0.01, ***P<0.001.

