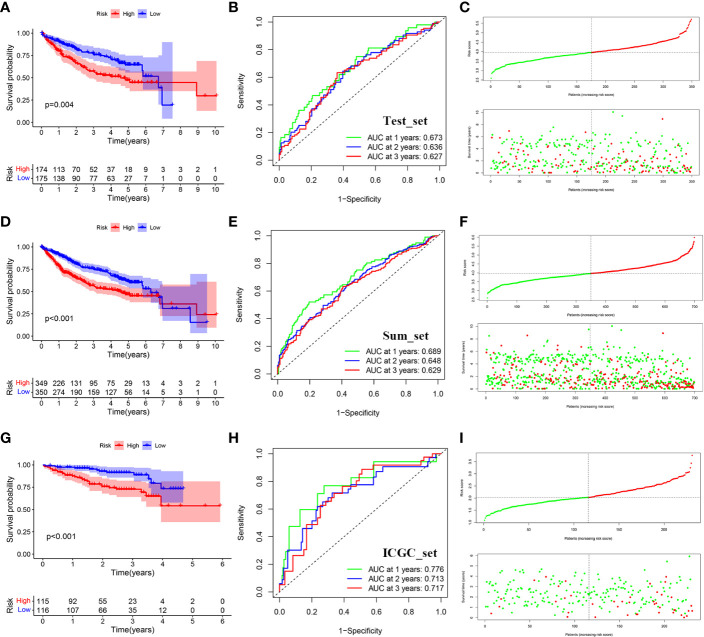
Figure 6.
Distribution of survival analysis, ROC and risk scores and survival outcomes for the validation set. (A) Survival analysis between the high and low risk groups in TCGA-test. (B) Receiver operating characteristic curve (ROC) of risk score in TCGA-test. (C) Distribution of risk scores and survival outcomes in TCGA-test. (D) Survival analysis between the high and low risk groups in TCGA-sum. (E) Receiver operating characteristic curve (ROC) of risk score in TCGA-sum. (F) Distribution of risk scores and survival outcomes in TCGA-sum. (G) Survival analysis between the high and low risk groups in ICGC. (H) Receiver operating characteristic curve (ROC) of risk score in ICGC. (I) Distribution of risk scores and survival outcomes in ICGC.

