Figure 3.

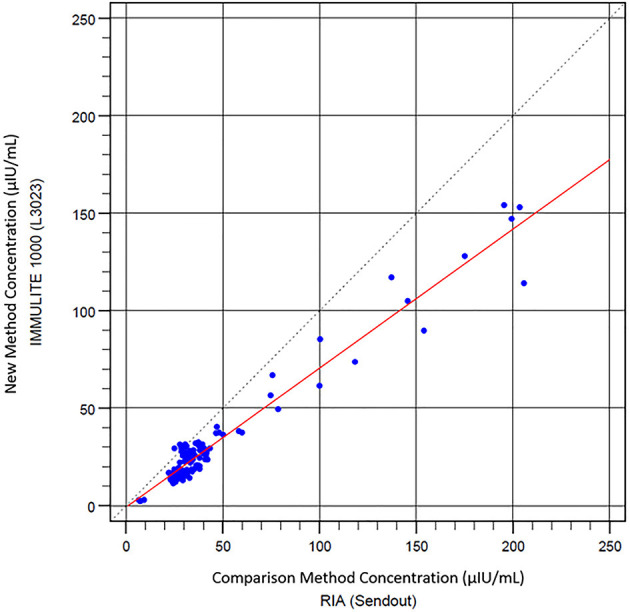
Scatter plot of Immulite® 1000 CLIA compared with RIA results. Least square regression analysis indicates a best-fit line (red) y = 0.713 x – 0.721.

Scatter plot of Immulite® 1000 CLIA compared with RIA results. Least square regression analysis indicates a best-fit line (red) y = 0.713 x – 0.721.