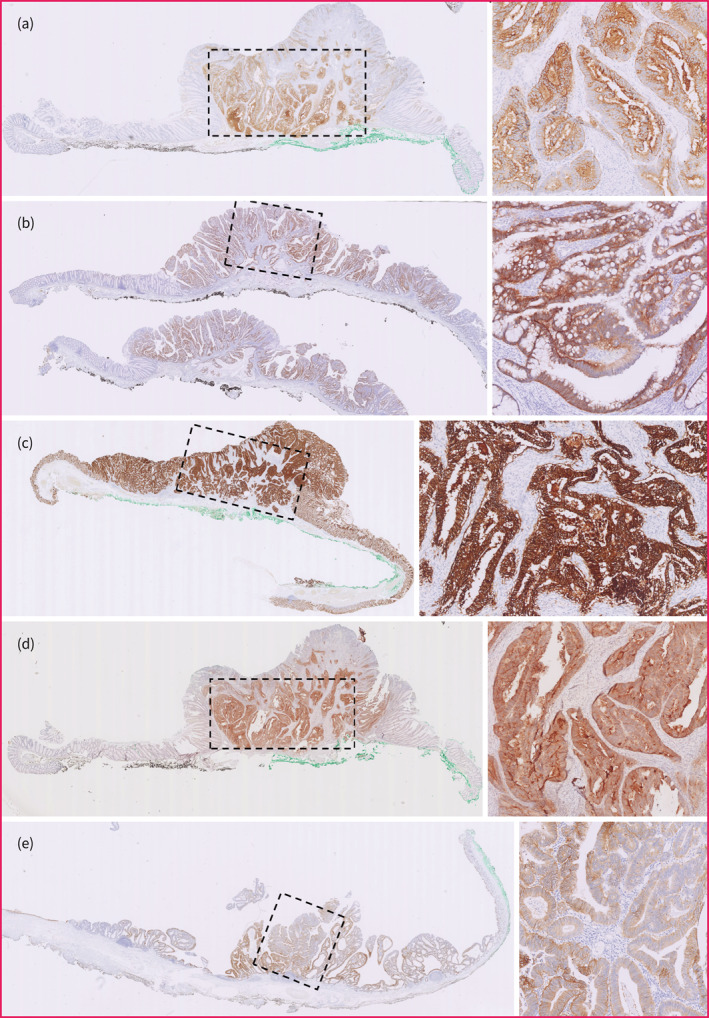
FIGURE 3.

Positive staining pattern of all targets in the high‐grade dysplasia (HGD) or T1 colorectal cancer (T1CRC) component. For each target, an illustrative case was selected with positive expression (i.e. staining score >1) in the HGD‐T1CRC component. The region enclosed by the rectangle with dashed line consists of HGD or T1CRC. An overview image (left) and enlargement of the HGD‐T1CRC region (right) are provided for each target. (a) CEA expression and (b) c‐MET expression. (c) EpCAM expression. (d) FRα expression. (e) αvβ6 expression. CEA, carcinoembryonic antigen; c‐MET, c‐mesenchymal‐epithelial transition factor; EpCAM, epithelial cell adhesion molecule; FRα, folate receptor.
