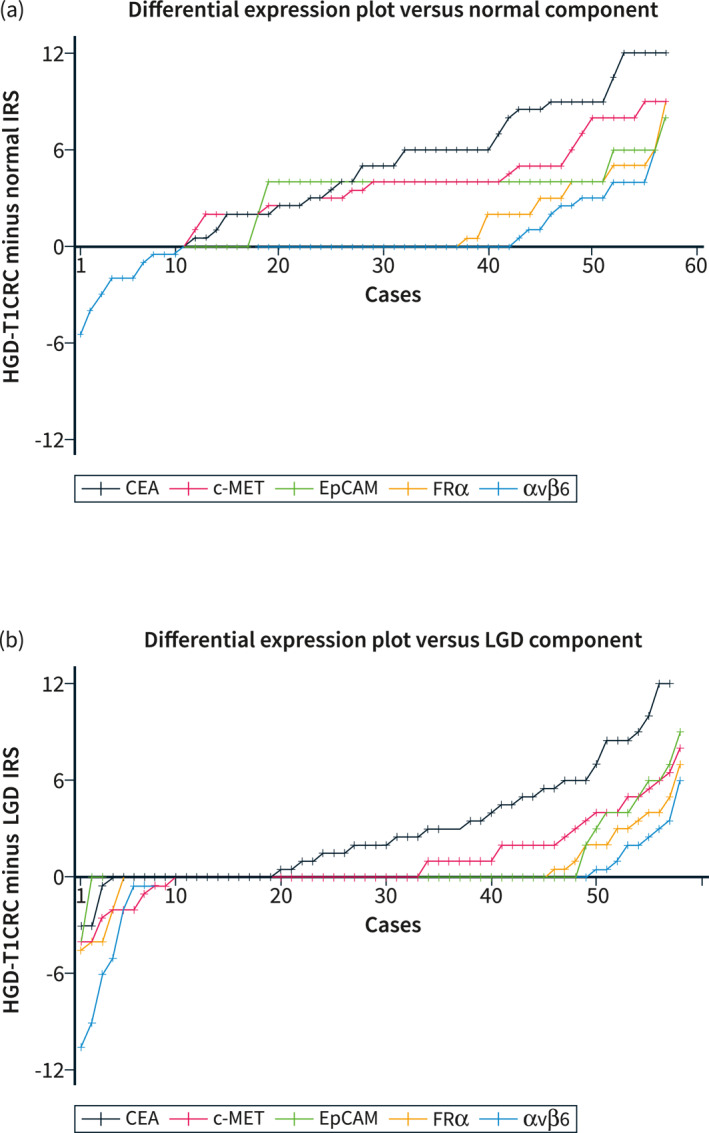
FIGURE 5.

Differential expression plots. Differential expression scores were calculated by subtracting the IRS of the normal or low‐grade dysplasia (LGD) component from the IRS of the HGD‐T1CRC component. Differential expression scores were independently arranged and connected in ascending order to demonstrate the distributions across the cohort. (a) shows the differential expression plot for HGD‐T1CRC components compared to surrounding normal colorectal tissue. (b) shows the differential expression plot for HGD‐T1CRC components compared to surrounding components of LGD. CEA, carcinoembryonic antigen; c‐MET, c‐mesenchymal‐epithelial transition factor; CRC, colorectal cancer; EpCAM, epithelial cell adhesion molecule; FRα, folate receptor alpha; IRS, immunoreactive score; LGD, low‐grade dysplasia.
