
Fig. 3.
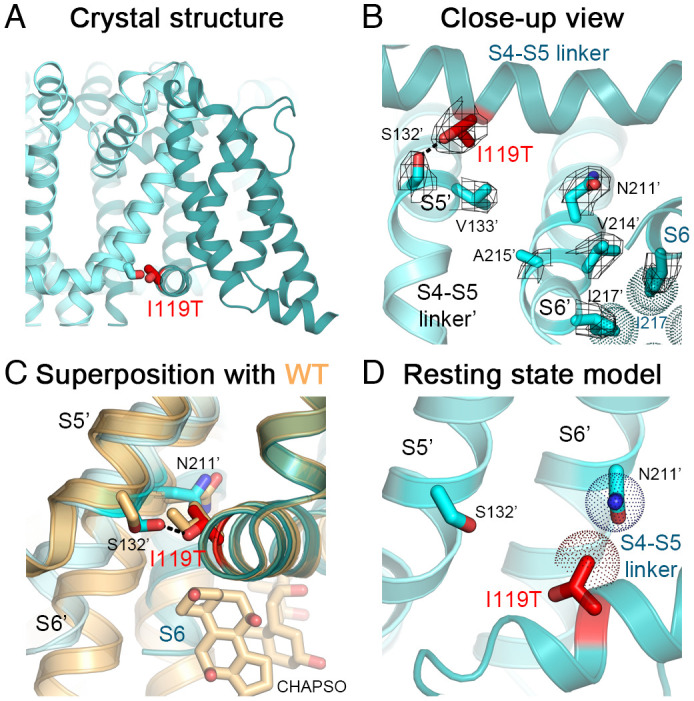
Structure of NaVAb/I119T. (A) Crystal structure of NaVAb/I119T with the mutation shown. (B) Close-up view of the NaVAb/I119T structure with the VS in the activated state (teal and cyan for different subunits). Side chains of residues I119T (red), I217 (teal) and key side chains in S5 and S6 of a neighboring subunit (cyan) including Ser132′ and Asn211′ are shown as sticks with the σA-weighted 2FO-FC electron density map contoured at 1.0σ level overlaid (mesh). (C) Comparison of NaVAb/I119T structure with the structure of NaVAb WT (light orange). Side chain of I119T forms a hydrogen bond (black dashes) with side chain of Ser132′. Conformational changes in the C-terminal end of the S6 segments starting from Asn211′ in the mutant structure abolish the CHAPSO binding site present in the WT structure. (D) Homology model of NaVAb/I119T structure in the resting state. The van der Waals hemispheres are shown as dots. NaVAbΔ28 (PDB: 6MWA) was used for the comparison.