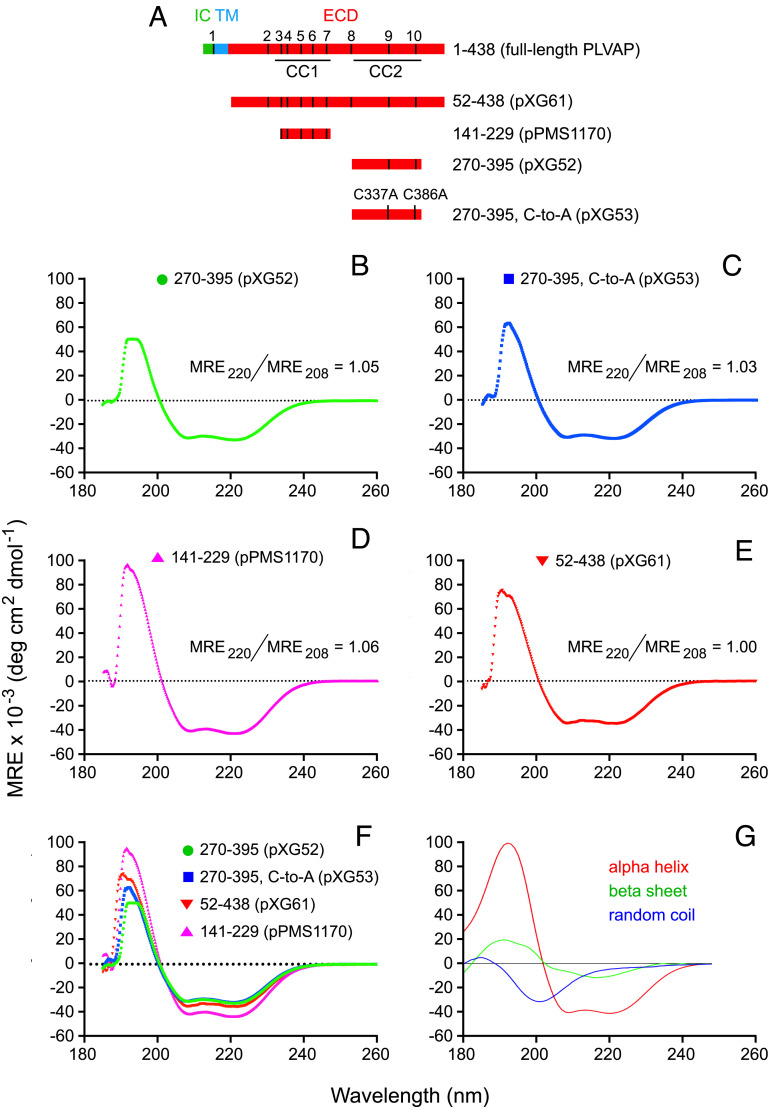
Fig. 2.
Circular dichroism (CD) spectra of the PLVAP ECD show predominantly alpha-helical content. (A) Map of full-length PLVAP (Top) and the four soluble ECD fragments analyzed by CD (Below). The 10 cysteines are numbered and represented by vertical black lines in the full-length schematic. (B–E), CD spectra of the indicated ECD segments. (F) Superposition of the four CD spectra. (G) Reference CD spectra for alpha-helix, beta-sheet, and random coil.

