Fig. 4.
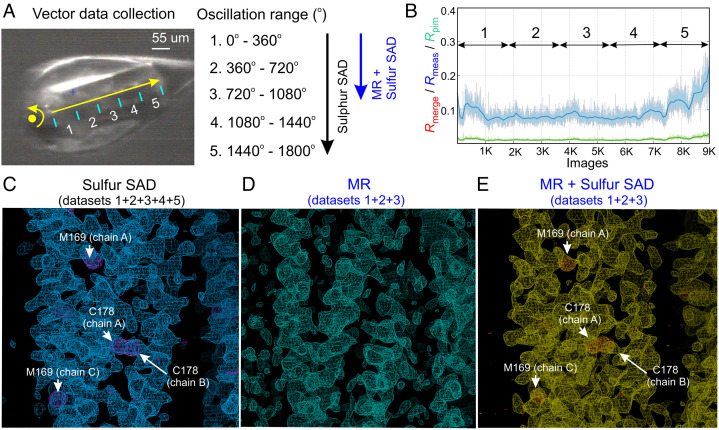
Data collection and phasing methods to determine the structure of PLVAP CC1. (A) The vector module established on the AMX beamline (NSLS II) was used to collect a continuous 1,800° oscillation range (9,000 images) along 300 μm of a single PLVAP CC1 crystal (P212121 space group). For the phase determination and analysis, every 360° rotation was scaled as a single dataset (1 to 5) using AIMLESS. (B) The plot shows the data quality for each image. The Rmerge (red lines) are not visible on the plot because they are completely overlapping with Rmeas (blue lines). Each 360° rotation is denoted by double-headed arrows. (C) The initial density-modified map (blue meshes) from PHENIX RESOLVE was calculated with experimental sulfur SAD phases from five datasets and is contoured at 1.3 σ. The anomalous difference map (purple meshes) for sulfur atoms is contoured at 3 σ with sulfur-containing residues labeled. (D) The initial electron density map (cyan meshes) from PHASER contoured at 1.3 σ, was obtained by MR using the computational model of PLVAP CC1 generated by the CCFold algorithm as the search model. (E) The initial density-modified map (yellow meshes) from PHENIX RESOLVE was calculated with the phases obtained by combining MR with sulfur SAD using only the first three datasets and is contoured at the 1.3 σ level. The anomalous difference map (red meshes) for sulfur atoms is contoured at the 3 σ level with sulfur-containing residues labeled.

