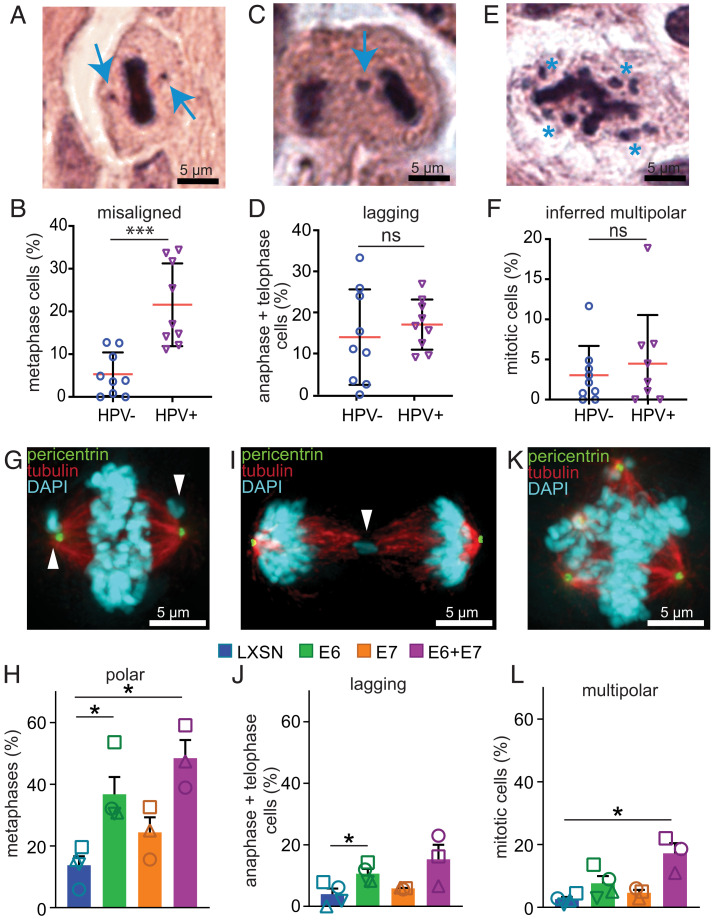
Fig. 1.
HPV16 E6 induces polar chromosomes in HNC. (A–F) HPV causes a specific increase in misaligned chromosomes in HNC patient biopsies. (A) HPV+ mitotic cell with two misaligned chromosomes (arrows). (B) Quantitation of misaligned chromosomes from HNC biopsies. n = average of 82 metaphases from each of 9 HPV− and 9 HPV+ patients. (C and D) HPV+ HNC do not have a higher incidence of lagging chromosomes than HPV− HNC. (C) HPV− cell with a lagging chromosome (arrow). (D) Quantitation of lagging chromosomes in HNC biopsies. n = average of 25 anaphase + telophase cells from each of 9 HPV− and 9 HPV+ patients. (E and F) Both HPV+ and HPV− HNC have a low incidence of multipolar spindles. (E) HPV+ cell with an inferred multipolar spindle based on the location of the chromosomes. The expected location of the spindle poles is indicated with asterisks. (F) Quantitation of inferred multipolar spindles in HNC patient biopsies. n = average of 132 mitotic cells from each of 9 HPV− and 9 HPV+ patients. (G–L) Expression of HPV16 oncogenes in NOKs demonstrates that E6 causes a specific increase in misaligned chromosomes near spindle poles (polar chromosomes). (G) E6 expressing NOK with polar chromosomes (arrowheads). (H) Quantitation of polar chromosomes. n > 45 metaphases from each of ≥3 independent experiments. (I) E6 expressing NOK with a lagging chromosome (arrowhead). (J) Quantitation of lagging chromosomes. n > 100 anaphase + telophase cells from each of ≥3 independent experiments. (K) E6 expressing NOK with a multipolar spindle. Centrosomes at spindle poles are indicated by pericentrin staining (green). (L) Quantitation of multipolar mitoses. n > 250 mitotic cells from ≥3 independent experiments. (H, J, and L) Shapes indicate values obtained from a given independent experiment. Error bars indicate SD (B, D, and F ) or SEM (H, J, and L). ***P < 0.0001, *P < 0.05, ns = not significant.

