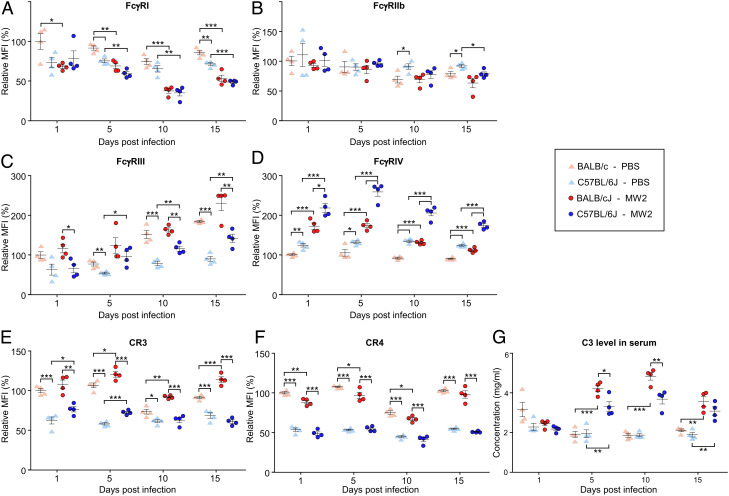
Fig. 5.
Relative levels of FcγRs and CRs in naïve and infected BALB/cJ and C57BL/6J mice. Animals that had received PBS or S. aureus MW2 (shown in SI Appendix, Fig. S5 A–C) were euthanized on day 1, 5, 10, or 15 post infection. Flow cytometry was used to gate for CD11b+Ly6G+ neutrophils (scheme shown in SI Appendix, Fig. S5D) that were subsequently stained with fluorescently labeled anti-FcγRI (A), -FcγRIIb (B), -FcγRIII (C), -FcγRIV (D), CR3 (E), and CR4 (F) antibodies. The fluorescence intensity of each receptor resulted in only one peak. As a result, the median fluorescence intensity (MFI) was used to represent the level of these receptors. 100% corresponds to the MFI measured for each receptor in the mock (PBS) BALB/cJ samples at day one. (G) Levels of complement component C3 in sera from naïve and infected BALB/cJ and C57BL/6J mice. Data are presented as mean ± SEM. Significant differences were identified with the two-way ANOVA with the Tukey test (***P < 0.001; **P < 0.01; *P < 0.05).

