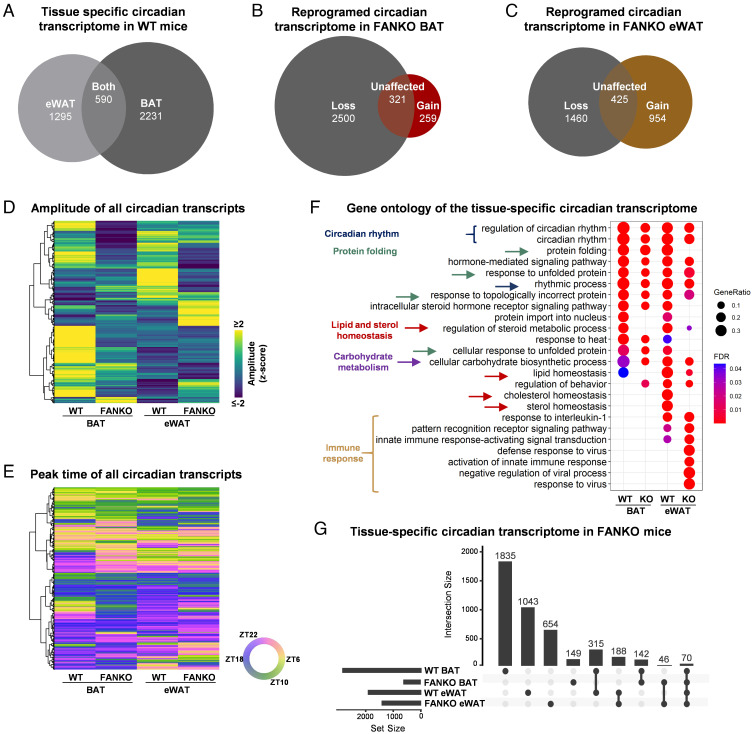
Fig. 2.
Nampt controls global adipose transcriptional rhythmicity through changes in circadian amplitude. Data from RNA sequencing performed on BAT and eWAT at ZT 6, 10, 18, and 22 from Fig. 1. (n = 4). (A) Euler diagram of oscillating transcripts in WT BAT and eWAT. (B) Euler diagram of oscillating transcripts in WT and FANKO BAT. (C) Euler diagram of oscillating transcripts in WT and FANKO eWAT. (D) Heatmap of amplitude and (E) peak time of rhythmic transcripts in BAT and eWAT of WT and FANKO mice. (F) Gene ontology analysis of circadian genes in all four groups. (G) UpSet plot showing selected overlaps of circadian rhythmicity of genes in the four groups. All analyses were performed with FDR cutoff < 0.01.

