Fig. 5.
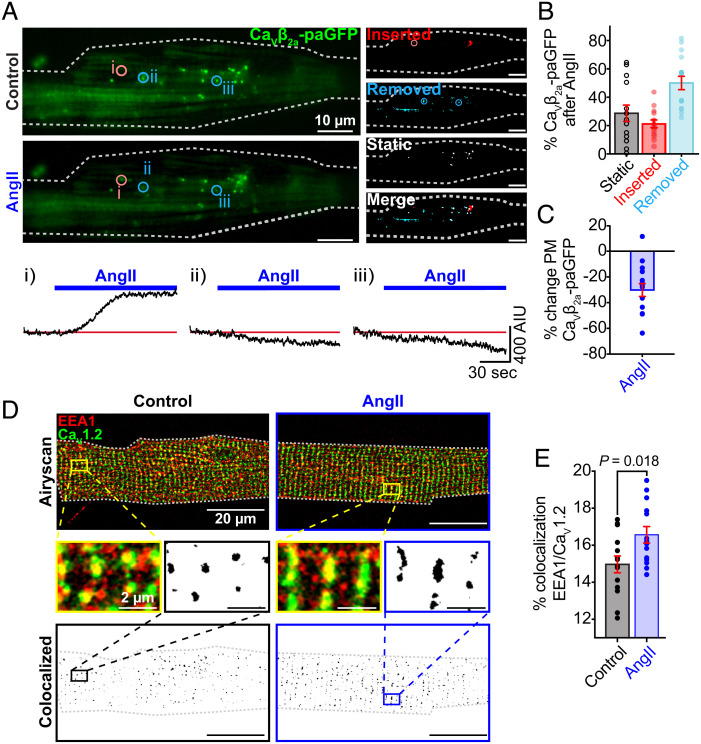
AngII promotes CaV1.2 channel removal from cardiomyocyte sarcolemmas and sequestration in early endosomes. (A) Representative TIRF images of GFP fluorescence emission from CaVβ2a-paGFP transduced cardiomyocytes before (Top) and after 100 nM AngII (Bottom) (N = 5, n = 14). Images illustrating stable, inserted, and endocytosed channel populations are shown to the Right. Time courses of the changes in CaVβ2a-paGFP intensity in individual ROIs (indicated by circles on TIRF images) are represented below. (B and C) Histograms summarizing the percentage of static, inserted, and removed channel populations after AngII (B) and the percentage change of TIRF-footprint CaVβ2a-paGFP fluorescence after AngII (C). (D) Two-color Airyscan super-resolution images showing distributions of CaV1.2 and EEA1+ early endosomes in representative control (Left) and AngII-stimulated (Right) myocytes. Binary colocalization maps (Bottom) display pixels in which CaV1.2 and endosomal expression fully overlap. (E) Histogram summarizing the percentage colocalization between EEA1 and CaV1.2 in control (N = 3, n = 14) and AngII-stimulated (N = 3, n = 13) conditions. Statistical analyses on data summarized E was performed using unpaired, two-tailed Student’s t-tests. Error bars indicate SEM.

