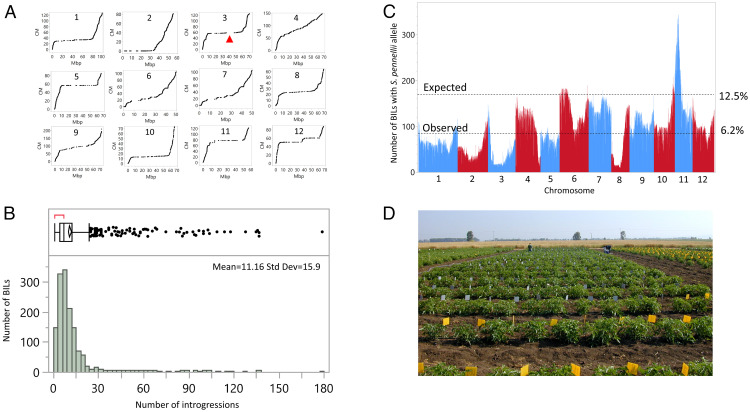
Fig. 1.
Genomic composition of the biparental BILs. (A) Plots of the physical (Mbp) and genetic (cM) distances of the 7,699 SPET markers of the 12 tomato chromosomes. The red arrowhead points to the largest gap detected in chromosome 3 (11 Mpb). (B) Frequency distribution of number of wild species introgressions per BIL. (C) The prevalence of the S. pennellii alleles in BC2S6 relative to the expected value of 12.5%. (D) A picture of the experimental plots in Akko showing the replicated single young plants each covering an area of 1 m2.

