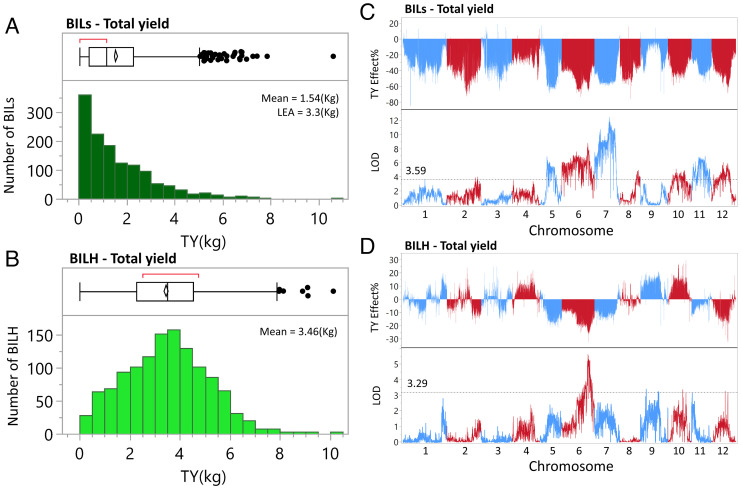
Fig. 2.
Identification of single yield QTLs in the BILs and BILHs. (A) Frequency distribution of total yield (TY, kg) in the 1,389 homozygote BILs. (B) Frequency distribution of TY (kg) in the 1,233 heterozygous BILHs. (C) Single marker analysis of TY (kg) in the BILs relative to the TY of LEA. LOD scores for each of the marker effects were calculated by the Haley–Knott regression, and the LOD threshold was determined by 1,000 permutation tests. (D) Single marker analysis of TY (kg) in the BILHs relative to the TY of LEA. LOD scores for each of the marker effects were calculated by the Haley–Knott regression, and the LOD threshold was determined by 1,000 permutation tests.

