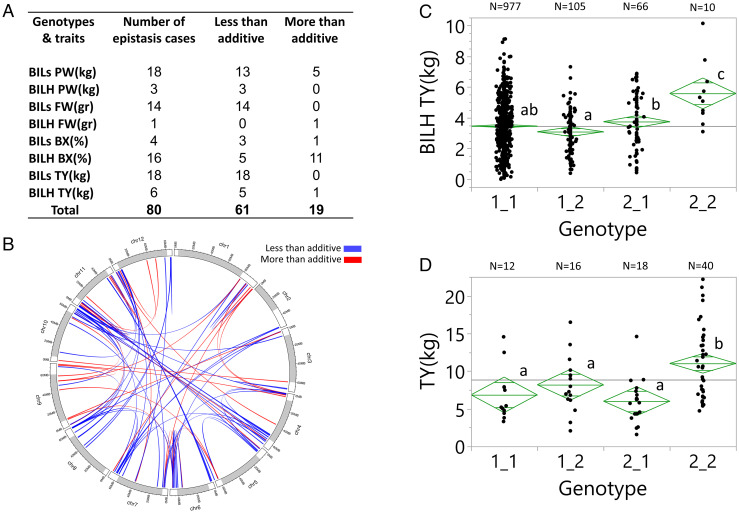
Fig. 3.
Identification and validation of epistatic QTLs. (A) Two-dimensional QTL scan of the BILs and BILHs for plant weight (PW), fruit weight (FW), Brix (BX), and total yield (TY) in dry conditions (Akko 2018). We used LOD fv1>316 to indicate significant epistasis. (B) Whole-genome circus epistasis plot. White segments on each of the chromosomes signify the euchromatic regions, and gray segments signify the heterochromatin. (C) Yield epistasis (Akko 2018) detected for markers on chromosomes 1 (SSL2.50CH01_95261222) and 7 (SSL2.50CH07_65737800) showing the number (N) of plants in each of the genotypic groups: 1) homozygous for the cultivated tomato alleles in chromosomes 1 and 7 (1_1), 2) heterozygous for the chromosome 1 introgression (2_1), 3) heterozygous for the chromosome 7 introgression (1_2), and 4) heterozygous for both introgressions (2_2). Genotypic group means showing the same letters are not significantly different at the 5% level based on the Tukey–Kramer test. (D) A validation test of the chromosomes 1 and 7 epistasis in F2 progenies of the double heterozygous BILHs (Akko 2020). Markers, genotypic groups, and statistical tests are the same as in Fig. 3C.

