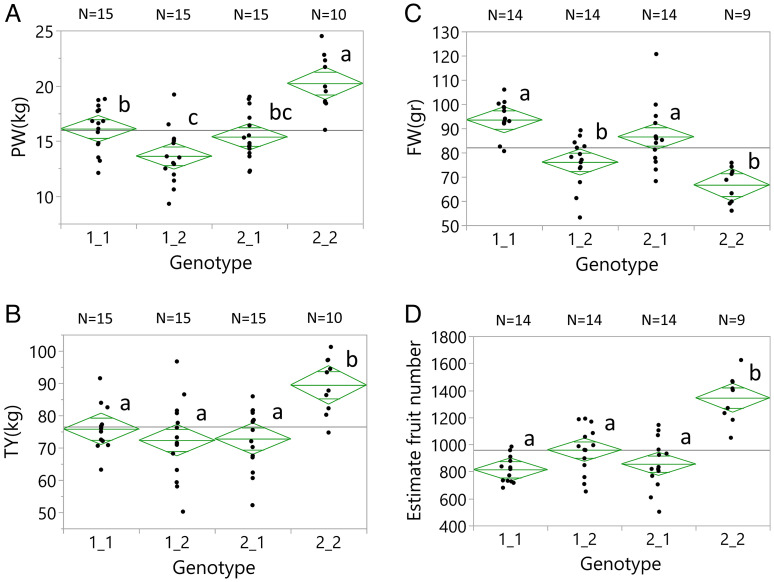
Fig. 5.
Validation of the epistatic QTLs in plots of commercial plant density. Yield components (Akko 2022) measured in 5-m2 plots with 12 plants each. We present the plots of the four genotypic groups with respect to the markers on chromosomes 1 (SSL2.50CH01_95261222) and 7 (SSL2.50CH07_65737800): 1) homozygous for the cultivated tomato alleles in chromosomes 1 and 7 (1_1), 2) heterozygous for the chromosome 1 introgression (2_1), 3) heterozygous for the chromosome 7 introgression (1_2), and 4) heterozygous for both introgressions (2_2). Genotypic group means showing the same letters are not significantly different at the 5% level based on the Tukey–Kramer test. The traits measured were PW (A), TY (B), fruit weight (C), and the estimated fruit number (D).

