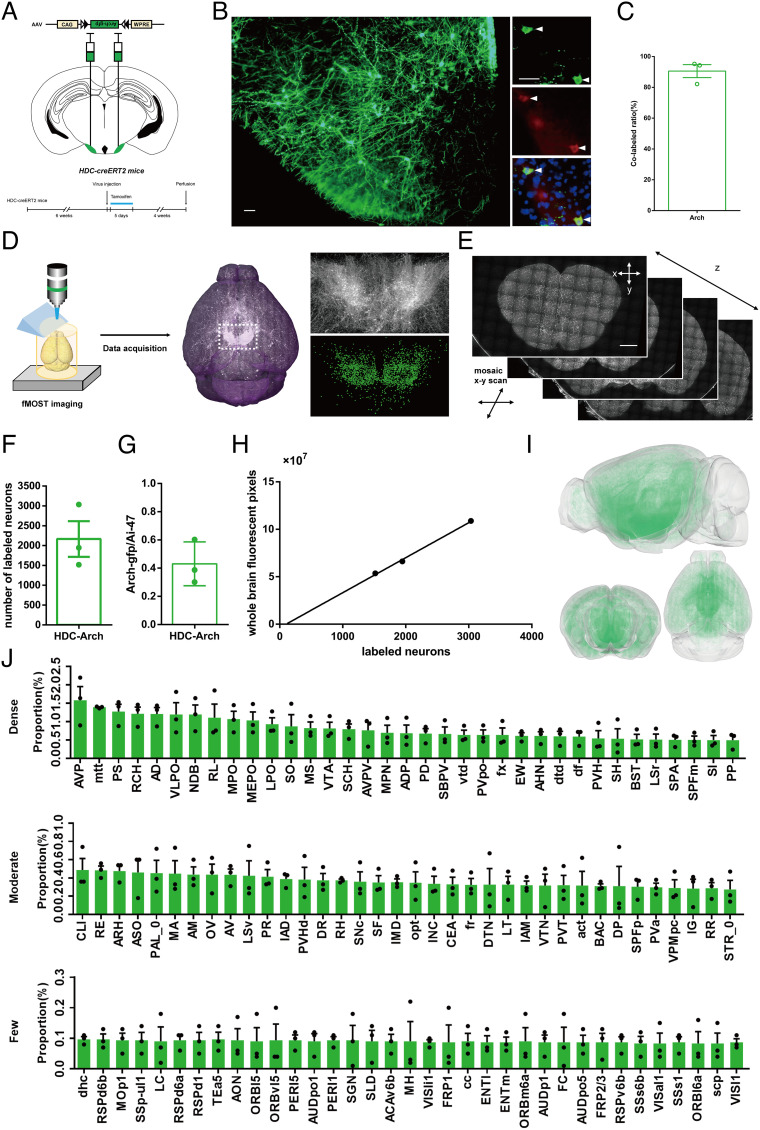
Fig. 2.
Virus-labeled histaminergic neurons and downstream circuits in HDC-Arch-GFPTMN mice. (A) Experimental scheme and timeline for generation of HDC-Arch-GFPTMN mice. AAV-CAG-FLEX-ArchT-GFP was injected into each side of the TMN of HDC-CreERT2 adult mice. (B) Representative immunohistochemical pictures of expression specificity in HDC-Arch-GFPTMN mice; GFP and HDC double-positive neurons are indicated by arrowheads. (Scale bars: 50 μm.) (C) Expression specificity analysis of GFP in HDC-Arch-GFPTMN mice. (D and E) Main steps of data generation, acquisition (D), and processing (E) in fMOST imaging. Raw data were analyzed by NeuroGPS system and manual correction. (Scale bars: 1 mm.) (F) Count numbers of fluorescently labeled neurons in the posterior hypothalamus of HDC-Arch-GFPTMN mice. (G) The ratio of fluorescent neurons in HDC-Arch-GFPTMN mice to the number of histaminergic neurons in the whole-brain. (H) Relationship between virus-labeled neurons and whole-brain fluorescent pixels (10 × 10 × 10 μm resolution) from 3 HDC-Arch-GFPTMN mice. (I) Fluorescent-labeled information visualization of registered HDC-Arch-GFPTMN mouse brain (Top: sagittal view; Bottom: coronal and horizontal views). (J) Fluorescence fiber density value of various brain regions in 3 HDC-Arch-GFPTMN mice. Top 35 brain regions in the groups “Dense,” “Moderate,” and “Few” are shown, respectively. See the details and list of abbreviations in SI Appendix, Table S1. All data are presented as mean ± SEM.

