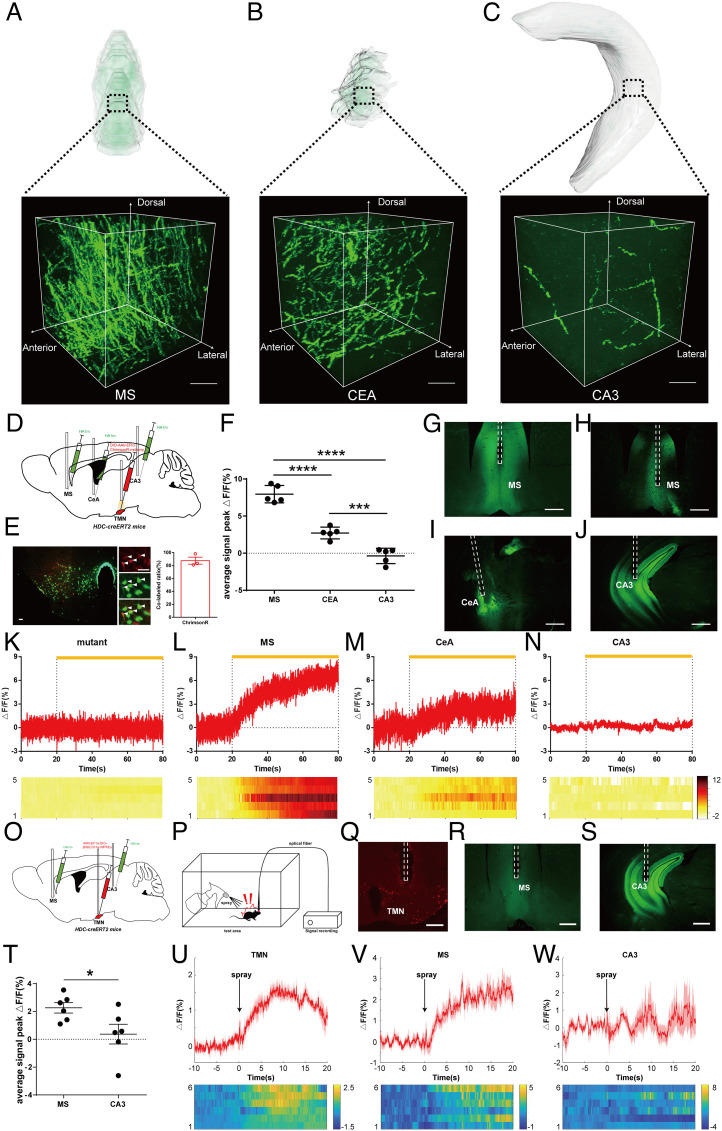
Fig. 3.
Positive correlation between histamine release and histaminergic fiber density in downstream brain regions. (A–C) Representative detailed 3D reconstruction images of MS (A), CeA (B), and CA3 (C): 200 × 200 × 200 μm3 with 0.32 × 0.32 × 2 μm3 pixel resolution. (Scale bars: 100 μm.) (D) Experimental scheme for generating HDC-ChrimsonR-mCherryTMN-HA1mMS, CeA, CA3 mice. AAV-hSyn-DIO-ChrimsonR-mCherry was injected into the right TMN of HDC-CreERT2 adult mice, and GRABHA was injected into the MS, right CeA, and right CA3 simultaneously. (E) Characterization of the injection site and coexpression analysis of expression specificity of HDC:Ai47-ChrimsonR-mCherryTMN mice, GFP, and mCherry double-positive neurons are indicated by arrowheads. (Scale bars: 50 μm.) (F) Average signal peak ΔF/F of 3 tested brain regions. (G) Representative image of the MS from an HDC-ChrimsonR-mCherryTMN-HAmutantMS mouse. (H–J) Representative images of the MS (H), CeA (I), and CA3 (J) from an HDC-ChrimsonR-mCherryTMN-HA1mMS, CeA, CA3 mouse. (Scale bars: 200 μm.) (K) Fiber photometry of MS histamine concentration by HAmutant sensor during stimulation by 589-nm yellow light. (L–N) Fiber photometry of MS (L), CeA (M), and CA3 (N) histamine concentration by HA1m sensor during stimulation by 589-nm yellow light in tested mouse. The signals of 5 mice are illustrated in the heatmap; color scale indicates ΔF/F and warmer colors indicate higher fluorescence signal. (O) Experimental scheme for generating HDC-jRGECO1αTMN-HA1mMS, CA3 mice. rAAV-EF1α-DIO-jRGECO1α was injected into the right TMN of HDC-CreERT2 adult mice, and GRABHA was injected into the MS, right CeA, and right CA3 simultaneously. (P) Experimental scheme for functional test of HA1m signal in aversive response of mice. (Q–S) Representative images of the TMN (Q), MS (R), and CA3 (S) from an HDC-jRGECO1αTMN-HA1mMS, CeA, CA3 mouse. (Scale bars: 200 μm.) (T) Average signal peak ΔF/F of MS and CA3. (U) Fiber photometry of TMN fluorescent signal during aversive response. (V and W) Fiber photometry of MS (V) and CA3 (W) histamine concentration by HA1m sensor during aversive response in tested mice. The signals of 6 mice are illustrated in the heatmap; color scale indicates ΔF/F and warmer colors indicate higher fluorescence signal. Aversive response: suddenly spray a stream of water on the back of the freely moving mouse. TMN, tuberomammillary nucleus; MS, medial septal nucleus; CeA, central amygdalar nucleus; CA3, field CA3.

