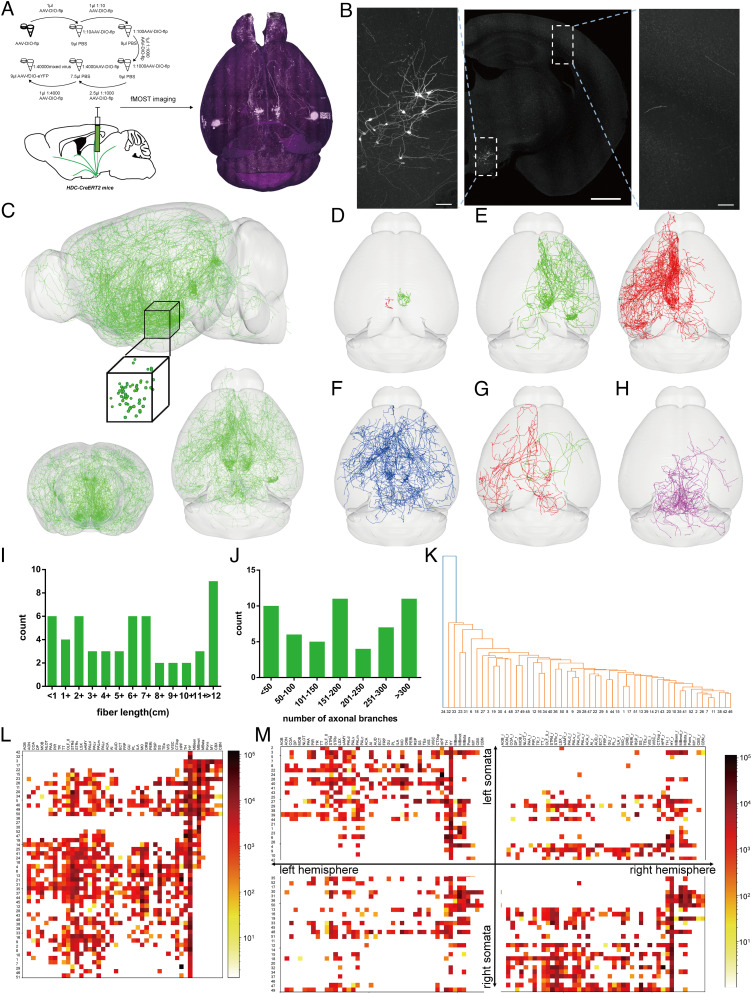
Fig. 4.
Whole-brain reconstruction of sparse-labeled single histaminergic neuron. (A) Main steps of data generation and acquisition in fMOST imaging of sparse-labeled single histaminergic neuron. (B) Representative images of the fluorescence-labeled neurons and fibers from an HDC-DIO-flp+fDIO-eYFPTMN mouse. (C) 3D views of 60 fully reconstructed histaminergic neurons from HDC-AAV-DIO-flp+AAV-EF1α-fDIO-eYFPTMN mice (Top: sagittal view with the cube representing the somatic location; Bottom: coronal and horizontal views). (Scale bar: 1 mm for Top, 100 μm for Bottom.) (D) Horizontal view of histaminergic neurons only projected to the local part of TMN. (E) Horizontal view of histaminergic neurons mainly projected to the anterior right and left hemisphere. (F) Horizontal view of histaminergic neurons mainly projected to both hemispheres. (G) Horizontal view of histaminergic neurons mainly projected to the contralateral hemisphere. (H) Horizontal view of histaminergic neurons mainly projected to the posterior part of the brain. (I and J) Interval distribution of all reconstructed histaminergic neuron fiber lengths (I) and axonal branch number (I). (K) Cluster analysis diagram of long-projecting neurons based on the detailed fiber distribution information. Every single branch indicates a different subgroup. (L and M) Heatmap shows the fiber length of long-projecting neurons in all major brain regions (L) and each hemisphere (M). Warmer colors indicate higher fiber length value.

