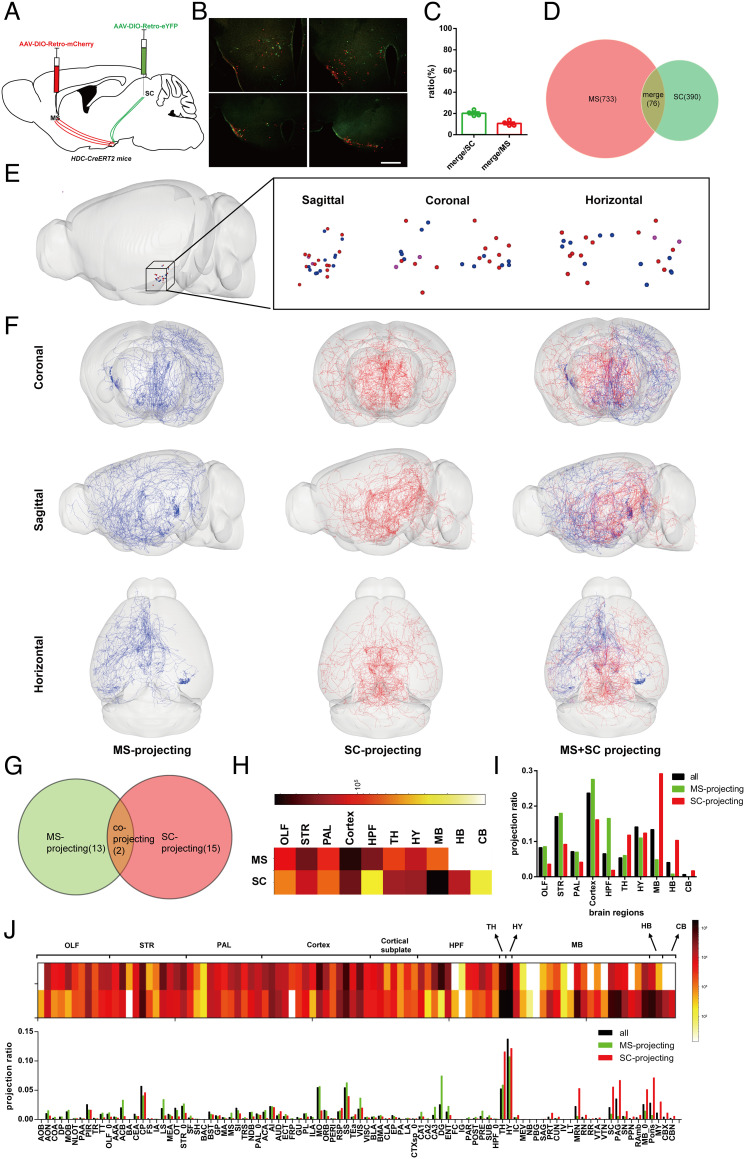
Fig. 5.
Whole-brain 3D structure for collateral projection analysis of MS/SC-projecting neurons. (A) Experimental scheme for generating HDC-Retro-mCherryMS-Retro-GFPSC mice. AAV-DIO-Retro-mCherry was injected into the MS of HDC-CreERT2 mice, and AAV-DIO-Retro-GFP was injected into the SC simultaneously. (B) Representative coronal sections showing Retro virus-labeled histaminergic somata in an HDC-Retro-mCherryMS-Retro-GFPSC mouse with several distance from bregma. (Scale bar: 400 μm.) (C) Co-label ratio of GFP and mCherry-labeled somata of 4 HDC-Retro-mCherryMS-Retro-GFPSC mice. (D) Venn diagram shows the number of all GFP and mCherry-labeled somata of 4 HDC-Retro-mCherryMS-Retro-GFPSC mice. (E) A 3D view of 26 MS- or SC-projecting histaminergic neuron somata (Left: sagittal view of the somatic location in the whole brain; Right: sagittal, coronal, and horizontal views of the somatic location). (F) A 3D visualization of whole-brain fiber distribution of MS- or SC-projecting neurons from different views. (G) Venn diagram shows the overlap of MS- and SC-projecting neurons. (H) Fiber length of MS- or SC-projecting neurons in the major brain areas are illustrated in the heatmap, and warmer colors indicate higher fiber length value. (I) Fiber length ratio (relevant brain areas/whole brain) of different groups in the major brain areas (black column: fiber length ratio of all 52 long projection neurons; green column: fiber length ratio of MS-projecting neurons; red column: fiber length ratio of SC-projecting neurons). (J, Top) Fiber length of MS- or SC-projecting neurons in the whole brain are illustrated in the heatmap, and warmer colors indicate higher fiber length value (top row: MS-projecting; bottom row: SC-projecting). (J, Bottom) Fiber length ratio (relevant brain areas/whole brain) of different groups in the whole brain (black column: fiber length ratio of all 52 long-projection neurons; green column: fiber length ratio of MS-projecting neurons; red column: fiber length ratio of SC-projecting neurons).

