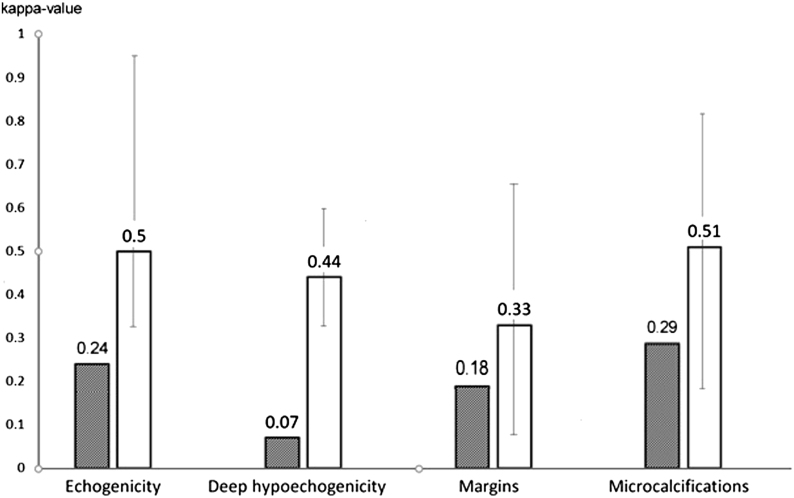
Figure 2.
Interobserver variation in the interpretation of certain ultrasound characteristics. For comparison purposes, we calculated Kappa-s, as earlier studies used Kappa values (4, 6, 14, 15, 16, 17, 18, 19, 20, 21, 22, 23). Gray bars: present study; white bars: median of literature data. Error bars represent ranges.

 This work is licensed under a