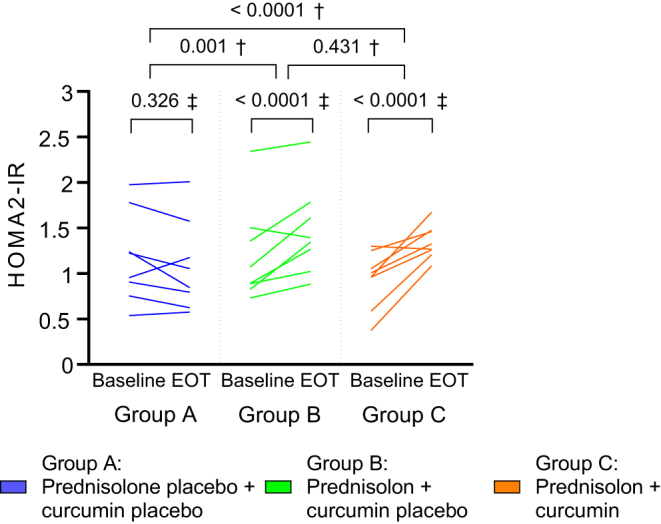
Figure 2.

Individual changes in homeostatic model assessment for insulin resistance (HOMA2-IR) from baseline to end-of-treatment (EOT) in the three intervention arms. †P value for treatment difference (between-group comparison); ‡P value for change from baseline to EOT (within-group comparison). P values are from constrained linear mixed model.

 This work is licensed under a