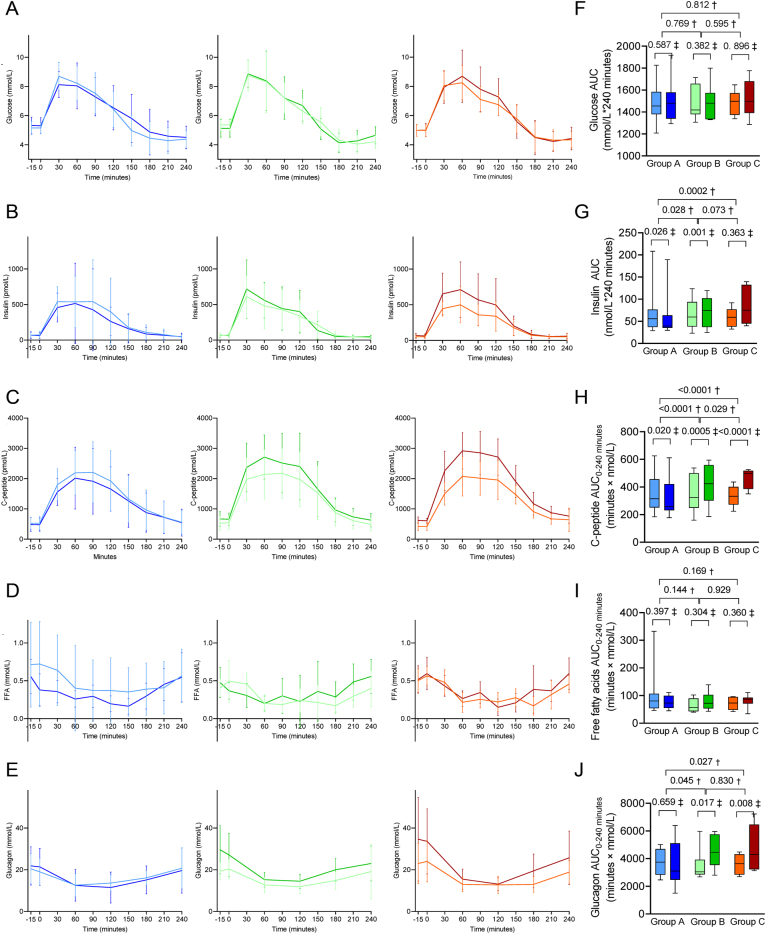
Figure 4.
Values (mean and SD) of glucose (A), insulin (B), C-peptide (C), free fatty acids (FFA) (D) and glucagon (E) measured during oral glucose tolerance test (OGTT) at baseline (light colours) and at end-of-treatment (EOT) (dark colours). The boxplots show median and IQR values for area under the curve (AUC) of the parameters measured during the OGTT (glucose (F), insulin (G), C-peptide (H), free fatty acids (I) and glucagon (J) at baseline (light colours) and at end-of-treatment (EOT) (dark colours)). Group A (blue): prednisolone placebo + curcumin placebo; Group B (green), prednisolone + curcumin placebo; Group C (red), prednisolone + curcumin. †P value for treatment difference (between-group comparisons), ‡P value for change from baseline to EOT (within-group comparisons) calculated using the constrained linear mixed model. Further statistical results can be found in Table 2.

 This work is licensed under a