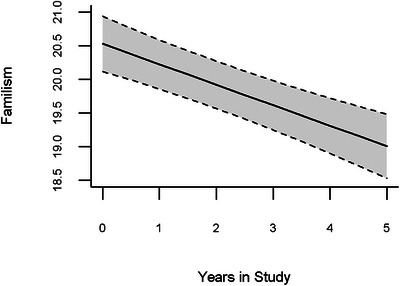
FIGURE 1.

Representation of change in familism over time with 95% confidence intervals also depicted in fully adjusted models (i.e., Model 2) accounting for age, sex, education, income, years living in one of the 50 US states and/or the District of Columbia, and interactions of each of these variables with time. Years in study as reflected on the x‐axis begins at study baseline (i.e., “0”) with each subsequent visit representing the first (“1”) repeat visit, the second (“2”) repeat visit, and so on, with “5” representing the fifth repeat visit. Given visits are annual and started with baseline, the fifth repeat visit equates to the 6th year in the study.
