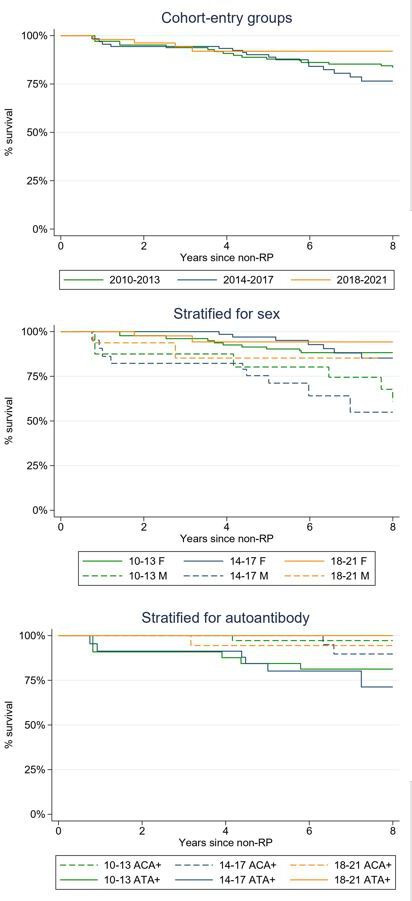
Figure 3.

Kaplan-Meier curves for survival according to cohort-entry groups for the Leiden CCISS cohort. In each figure, the green lines represent the patients from 2010 to 2013 group, the blue lines from 2014 to 2017 and the orange lines from 2018 to 2021. The upper figure shows the Kaplan-Meier curves for 8-year survival for the cohort-entry groups, the middle for cohort-entry groups stratified for sex and the lower for the cohort-entry groups stratified for autoantibody status. ACA, anticentromere autoantibody; ATA, antitopoisomerase antibodies; CCISS, Combined Care in Systemic Sclerosis; F, female; M, male; RP, Raynaud’s phenomenon.
