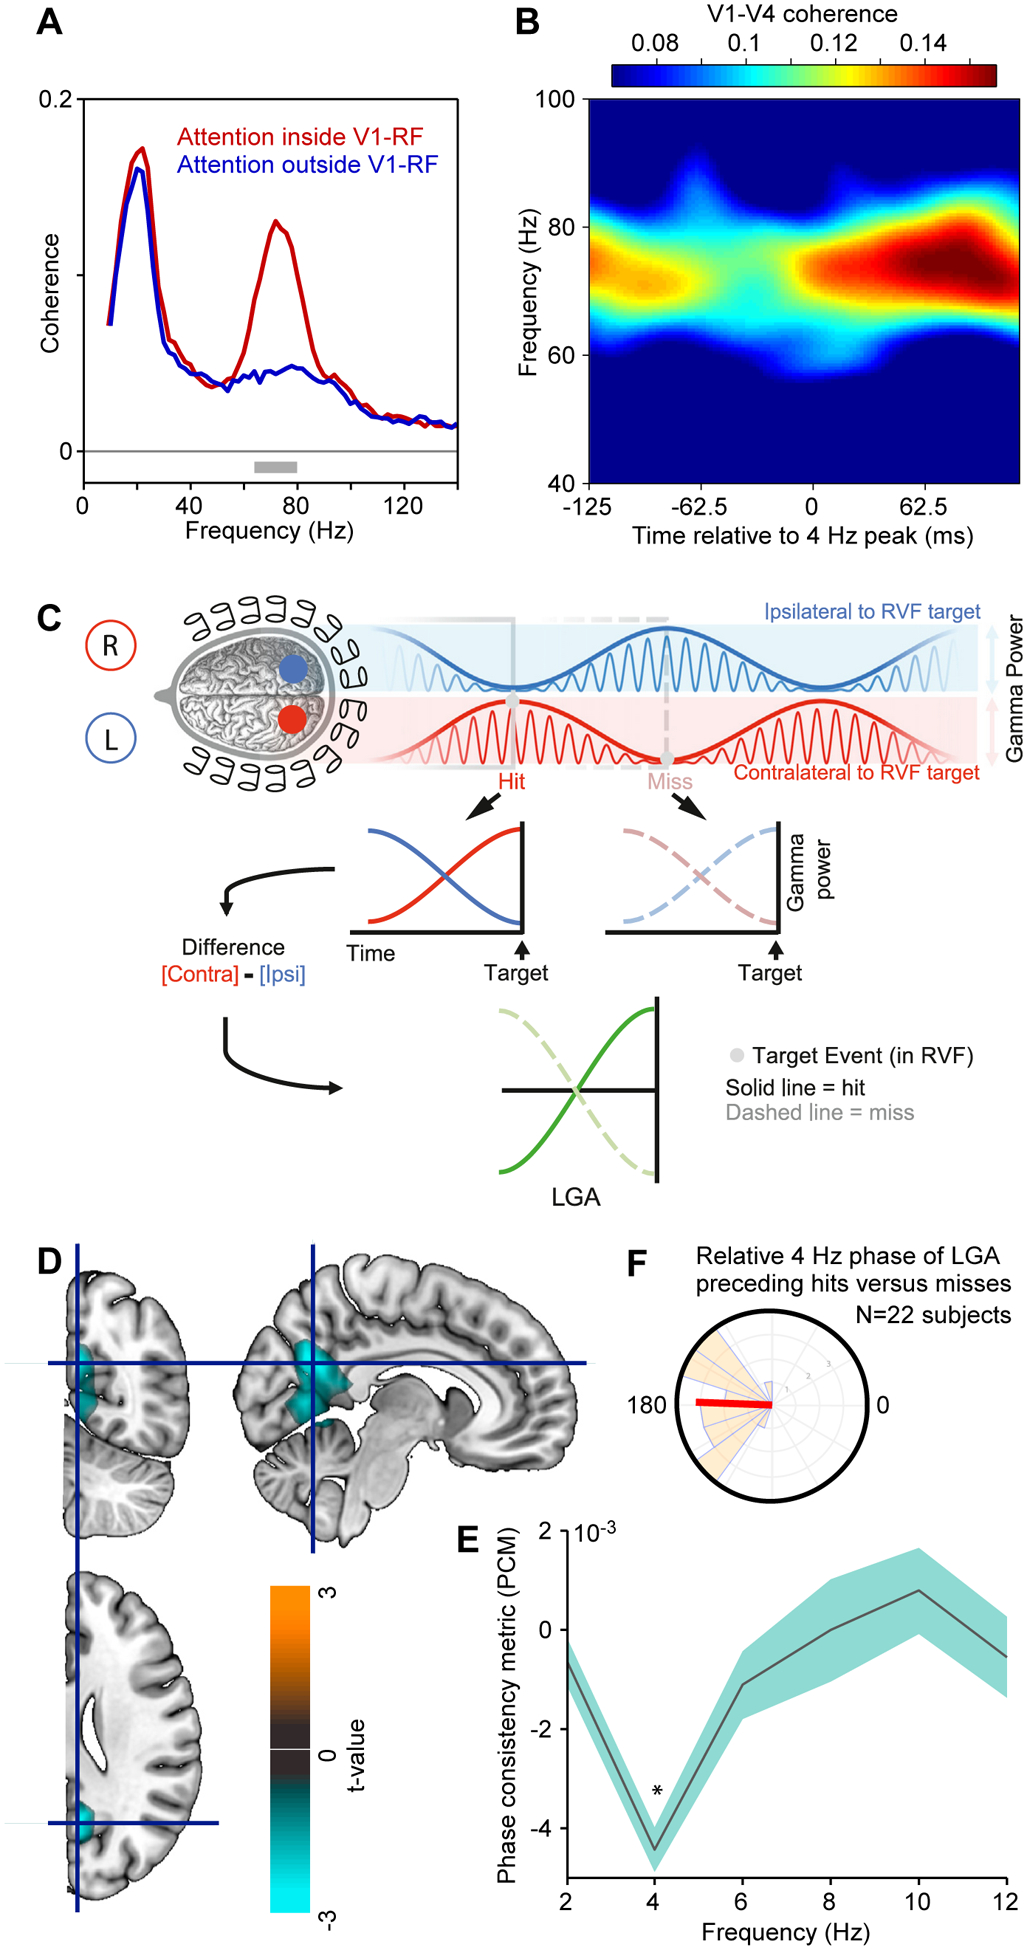
Figure 3. Theta-rhythmic attentional sampling without an attentional reset event.

(A) Spectral coherence between neuronal activities recorded in areas V1 and V4 of a macaque, when selective attention is inside (red) or outside (blue) the V1-RF. The V1 site is activated by one of two simultaneously presented grating stimuli, which both activate the V4 site approximately equally.
(B) Same analysis as the red line in (A), i.e. V1-V4 coherence during attention inside V1-RF, yet here analyzed as a function of the time relative to 4 Hz peaks (x-axis), and color coded as shown by the color bar on the top.
A,B adapted and modified from Bosman et al.25.
(C) Illustration of a test for rhythmic attentional sampling in human subjects with MEG, leading to the results in (D-F). Two visual stimuli in the two visual hemifields induce two gamma rhythms in the respective opposite hemispheres, whose amplitude envelopes (thick blue and red lines) are modulated at theta, in antiphase between the hemispheres/stimuli. The difference between those envelopes, the lateralized gamma-band activity (LGA; green lines), eliminates unspecific fluctuations, and isolates momentary attentional biases to one versus the other stimulus. The LGA can be analyzed for the time period preceding stimulus changes that were detected (hit, solid green line) or remained undetected (misses, dashed green line).
(D) The experimentally obtained LGA was spectrally analyzed, and significant anti-phase relationship (phase consistency metric, PCM) preceding hits versus misses was quantified at the MEG source level. Across sources and frequencies (2–20 Hz), there was one significant cluster of adjacent sources spanning calcarine sulcus, lingual gyrus, and precueneus gyrus, whose t-values (two-sided t-test across subjects) is shown here as color code.
(E) PCM averaged over the sources in the cluster from (D), as function of frequency. The anti-phase relationship existed specifically at 4 Hz.
(F) Distribution of relative 4 Hz phase of LGA preceding hits versus misses, across the 22 subjects. C-F adapted and modified from Landau et al.58.
