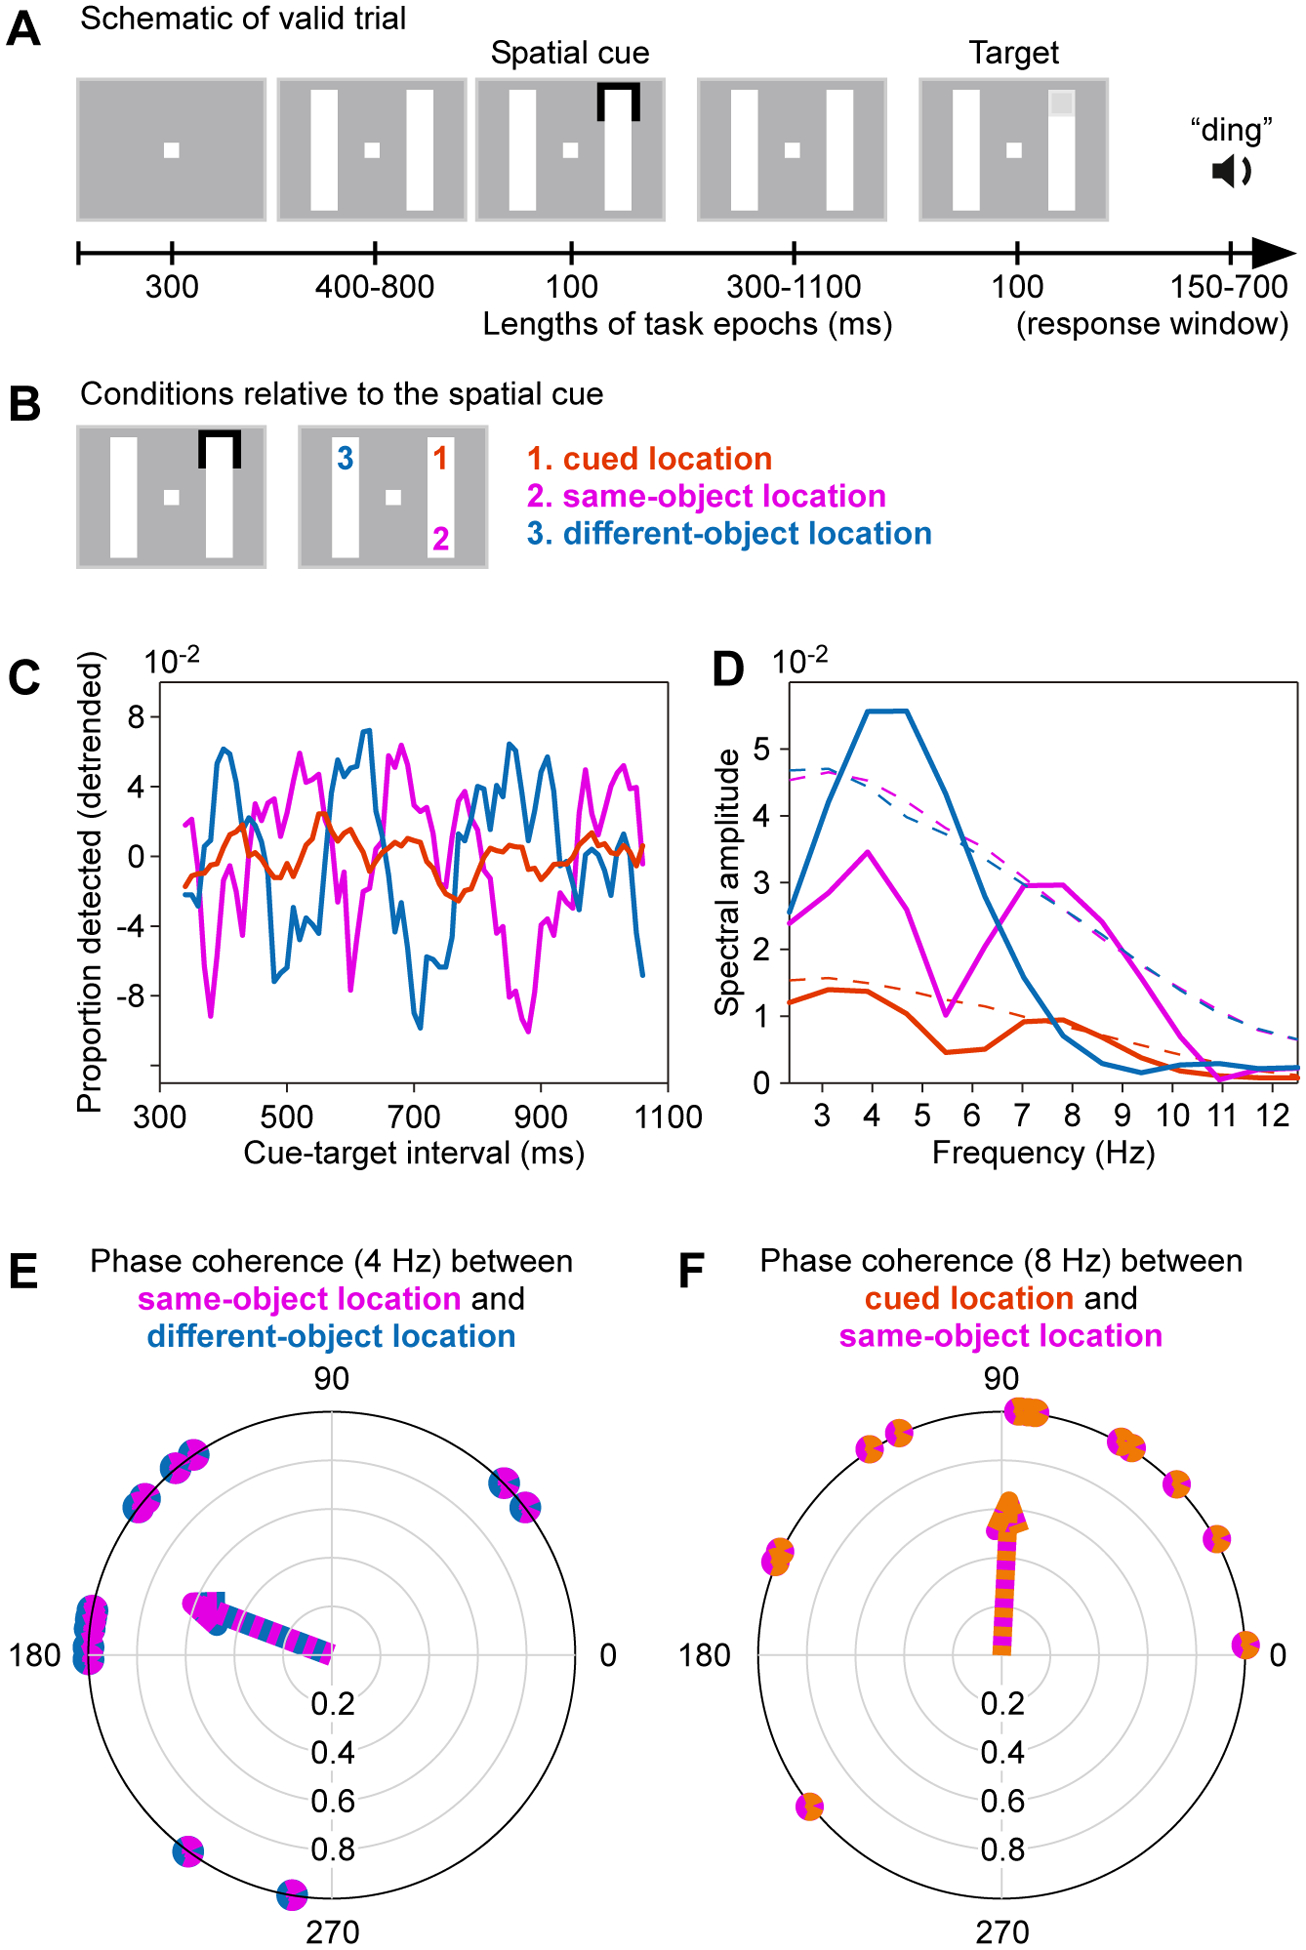
Figure 5. Evidence consistent with rhythmic attentional scanning within a stimulus.

(A) Trial structure of a psychophysical experiment to investigate rhythmic sampling within and between stimuli. During continued fixation, two bars are shown, and one end of one bar is cued. The cue acts as attentional reset event. At a variable time after the cue, the target appears at the cued location, illustrated here (valid trial), or at one of two alternative positions shown in (B).
(B) The bars can be arranged vertically, as shown here, or horizontally. The cue-flash can appear at either one of the ends of either one of the bars. If the cue-flash appears as indicated on the left, the possible target locations are as indicated on the right, with their respective labels and color codes, used in (C-F).
(C) Target detection performance as function of cue-target interval, separately for the three conditions, as color-coded in (B).
(D) Power spectra (solid lines) and their corresponding significance thresholds (dashed lines). Note that power spectra of the cued location (orange) cannot be directly compared to the other power spectra, because this location was probed in far more trials.).
(F) Each dot on the outer circle reflects, for one participant, the phase relation at 4 Hz between their detection performances at the same-object versus different-object location. The arrow points toward the average phase relation.
(F) Same as (F), but for the phase relation at 8 Hz between detection performances at the cued location versus the same-object location.
A-F adapted and modified from Fiebelkorn et al.45.
