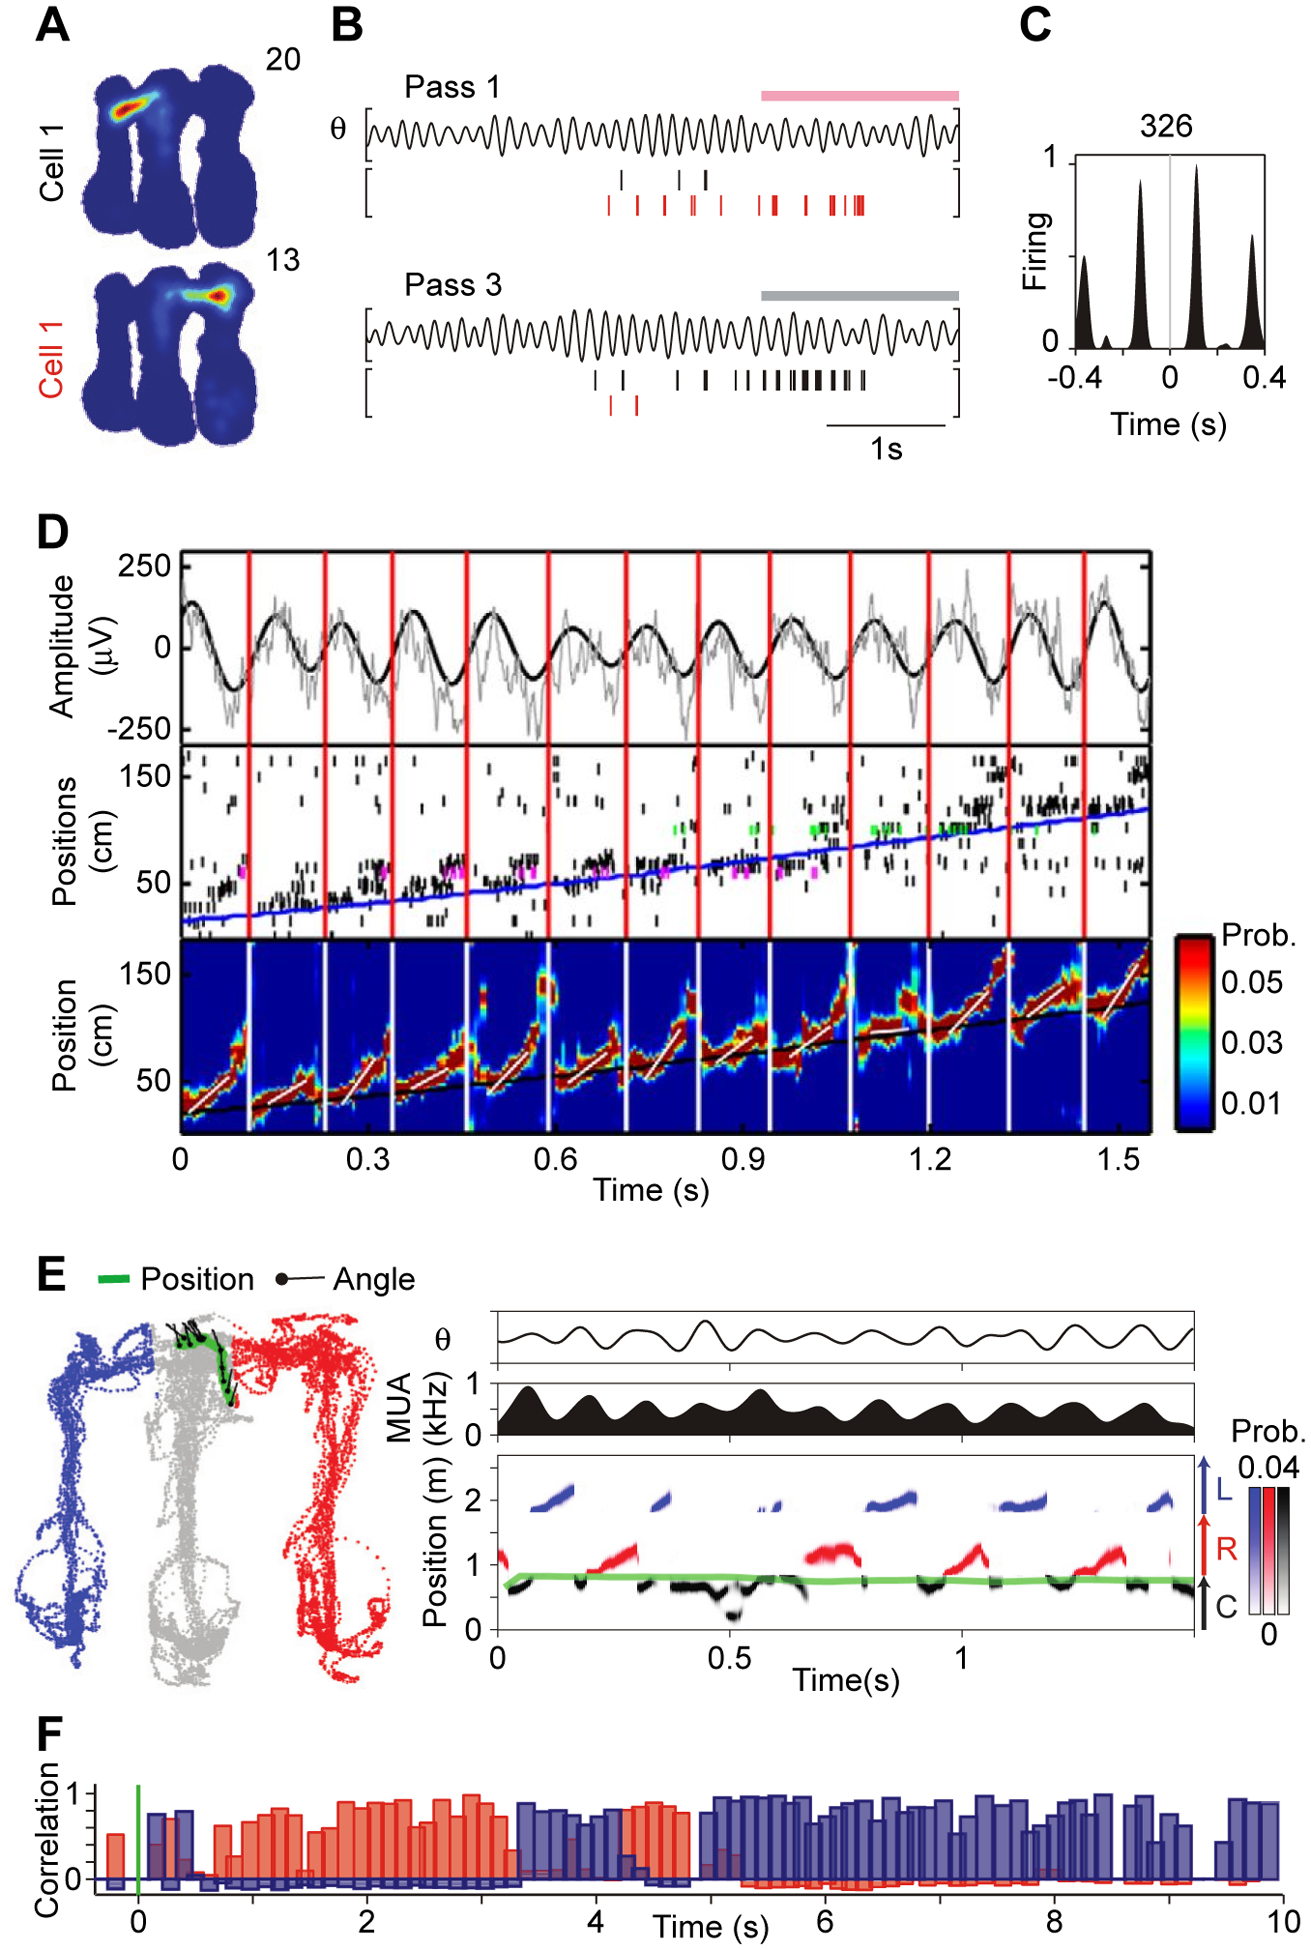
Figure 7. Theta-rhythmic scanning of space by hippocampal place cells firing in theta sequences.

(A-C) Data recorded from rat hippocampus, while a rat ran in an m-shaped maze. At the end of each of the three arms, rewards could be delivered. Rats were rewarded for alternately running from the center arm into the left and right arm.
(A) Firing maps of two simultaneously recorded cells in rat hippocampus. The firing map of Cell 1 extends from the center arm into the left arm, the firing map of Cell 2 extends into the right arm.
(B) Data recorded during three outbound passes from the center arm into either the right or the left arm. Pink (gray) horizontal bar marks entry into the right (left) arm. For each pass, the upper plot shows the LFP filtered in the theta band (here: 5–11 Hz), and the lower plot shows the spike times of Cell 1 (black vertical lines) and Cell 2 (red vertical lines).
(C) Crosscorrelogram between the spike times of Cell 1 and 2.
A-C adapted and modified from Kay et al.57.
(D) Data recorded from rat hippocampus, while a rat ran a single pass on a linear track. Top plot: Raw LFP (gray) and LFP filtered in the theta band (here: 4–12 Hz, black). Middle plot: Spikes recorded simultaneously from 107 pyramidal cells in hippocampal CA1. Pyramidal cells are ordered along the y-axis by their peak firing positions along the track (magenta and green indicate spikes from example neurons shown in more detail in other plots of the original paper, but not here). Bottom plot: Spike-decoder based probability estimates (color coded) of the rat’s position, referred to as theta sequence. The beginning and end of each theta sequence is indicated by vertical lines running across the three panels (red for top and middle, white for bottom plot). In the bottom plot, the superimposed short oblique white lines indicate the speed of each theta sequence. In the middle (bottom) plots, the superimposed long oblique blue (black) line indicates the running trajectory of the animal. Adapted and modified from Feng et al.61.
(E) Same study as illustrated in (A-C), but now decoding theta sequences during a single pass (similar to what is done in (D)) while the animal is at the decision point, at the end of the center arm, with the options to run either into the left or the right arm. Left plot: Position (green) and head angle (black lines) superimposed on positions visited by the rat (color-coded by maze arm: gray=center, blue=left; red=right). Right panels: Top: Theta-filtered LFP (here: 5–11 Hz); Middle: Multi-unit activity; Bottom: Spike-decoder based probability estimates. Decoded position is color coded by arm: Black=Center (C), Red=Right (R), Blue=Left (L). Adapted and modified from Kay et al.57.
(F) Pearson product-moment correlations showing evolution of population vector correlations after spatial cue switching from box I to II (red, correlation with I; blue, with II; green line, cue switch). Each bar corresponds to one theta cycle. Note frequent flickers to the original representation after cue switching. Adapted and modified from Jezek et al.68.
