
FIGURE 3.
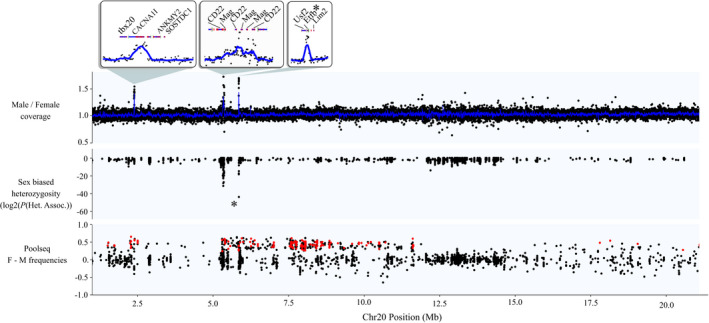
Signals of sex linkage along Chromosome 20, the putative sex chromosome in C. inconstans. For the coverage panel, each point represents male/female coverage in a 1 kb window. The blue line represents the rolling average across 10 windows. The asterisk in the heterozygosity panel and the zoomed box above represents the single completely sex‐linked variant that aligned to Chromosome 20 (in the gene Eftb). For the pooled sequencing panel, red points represent those with parental genotypes and pool frequencies that fit expectations of sex linkage (see Section 2)