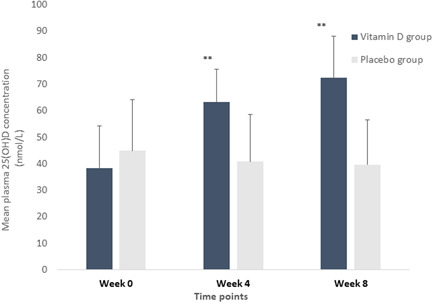
Figure 2.

Plasma 25(OH)D concentrations at each timepoint during the 8‐week intervention in the vitamin D and placebo groups. Values are presented as the mean ± SD indicated as vertical error bars. Asterisks above error bars denote a statistically significant within‐group difference in plasma 25(OH)D concentration at that time point compared to baseline (week 0), analysed using the Mann–Whitney U test (p ˂ 0.001).
